
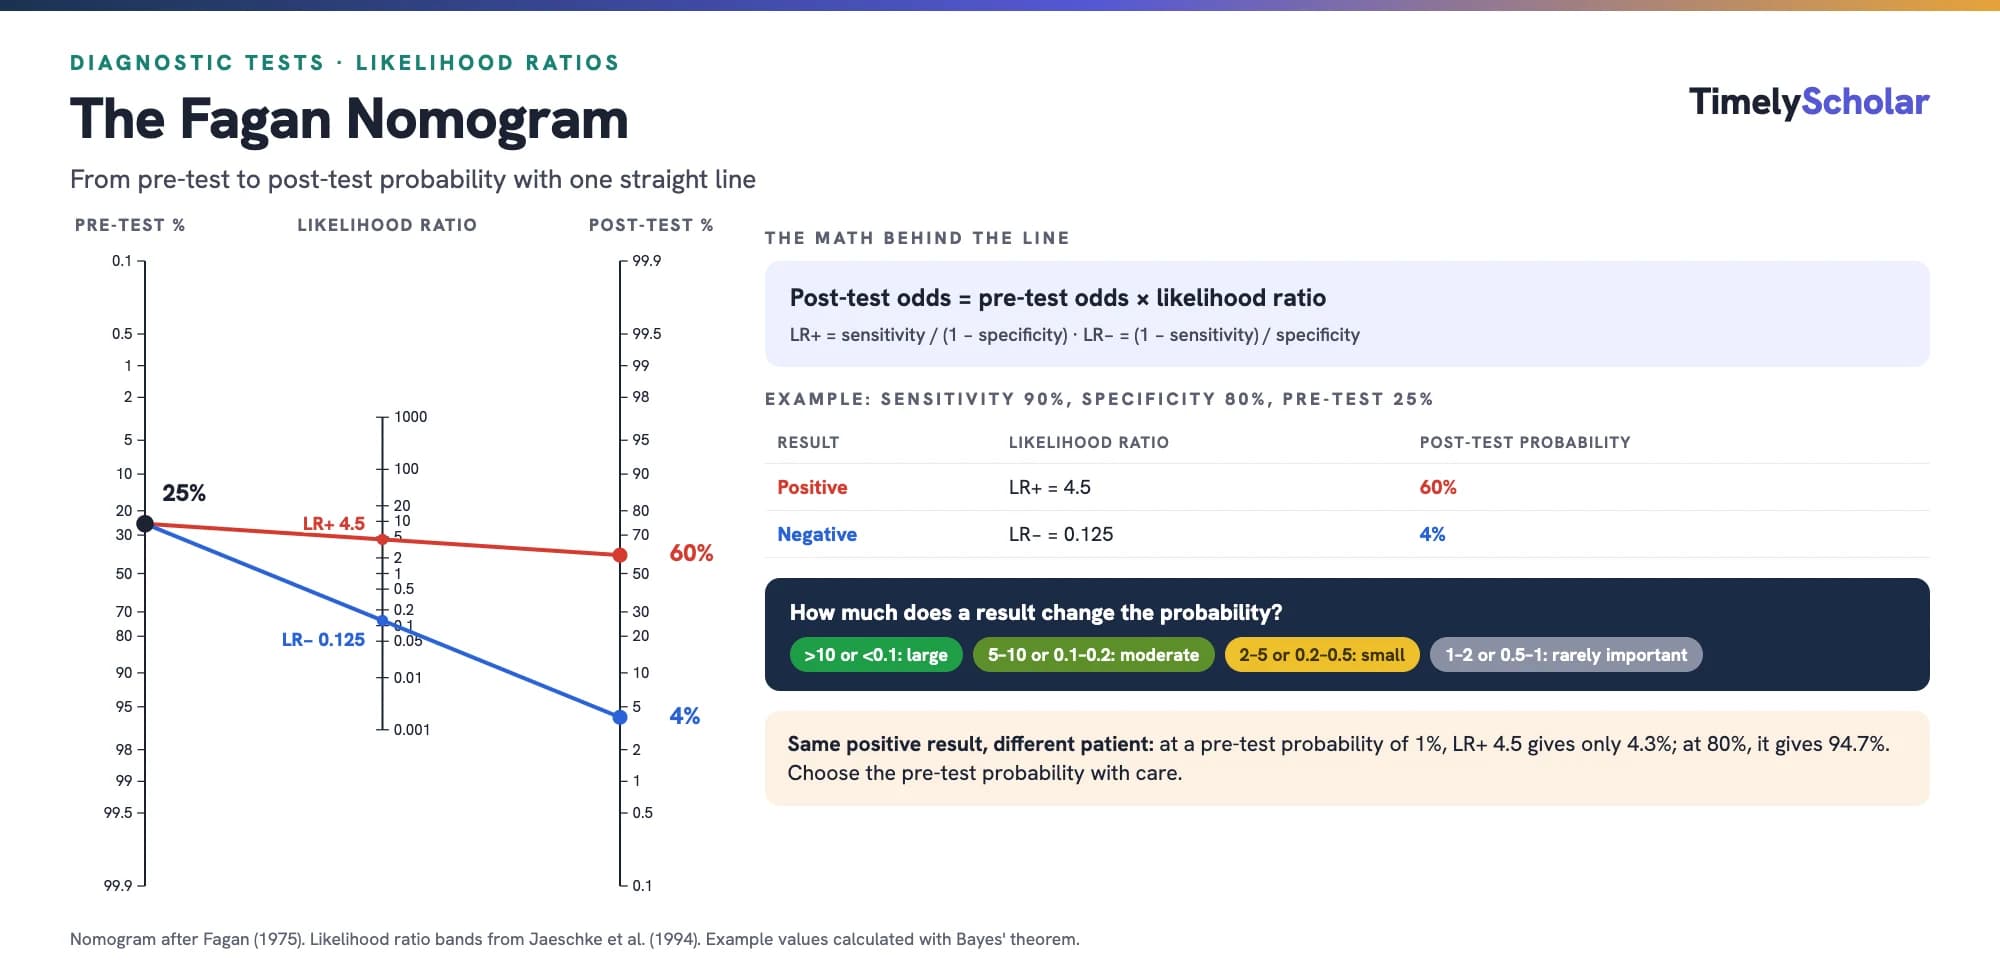
The Fagan nomogram is a chart that turns a pre-test probability and a likelihood ratio into a post-test probability without any arithmetic: you draw a straight line from the pre-test probability on the left axis through the test's likelihood ratio on the middle axis, and read the post-test probability where the line meets the right axis [1,2]. Behind the line is Bayes' theorem: post-test odds = pre-test odds × likelihood ratio [2]. A likelihood ratio above 1 raises the probability of the condition, one below 1 lowers it, and one of exactly 1 changes nothing [3]. For example, at a pre-test probability of 25%, a test with 90% sensitivity and 80% specificity (LR+ 4.5, LR− 0.125) moves the probability to 60% after a positive result and 4% after a negative one. The answer is only as good as the pre-test probability and likelihood ratios you put in, so this guide also covers how to choose them, how to interpret the result, and when the method breaks down.
Building an evidence-based practice project? A specialist can guide you through it. Get a free quote →
What is the Fagan nomogram?
T. J. Fagan published the nomogram as a one-page letter in the New England Journal of Medicine in 1975 [1]. It is a graphical tool for calculating the post-test probability from the pre-test probability and the likelihood ratio [4], and its purpose is to save you converting between odds and probabilities by hand [2].
It has three vertical axes [4]:
- Left: pre-test probability, the probability that the patient has the condition before the test.
- Middle: likelihood ratio of the test result.
- Right: post-test probability, the probability of the condition after the result.
The nomogram answers one question: given what I thought before the test, how likely is the condition now? It does not tell you whether a test is accurate. That comes from diagnostic accuracy studies, which you can appraise with QUADAS-2 or QUADAS-3.
Likelihood ratios and Bayes' theorem: the math behind the line
A likelihood ratio compares how often a particular test result occurs in people with the condition and in people without it: it is the probability of that result in people with the disease divided by the probability in people without it [2]. For a test with two results, positive and negative, there are two likelihood ratios [2]:
| Quantity | Formula |
|---|---|
| Positive likelihood ratio (LR+) | Sensitivity / (1 − specificity) |
| Negative likelihood ratio (LR−) | (1 − sensitivity) / specificity |
| Pre-test odds | Pre-test probability / (1 − pre-test probability) |
| Post-test odds | Pre-test odds × likelihood ratio |
| Post-test probability | Post-test odds / (1 + post-test odds) |
Likelihood ratios run from 0 to infinity [5]. The further a likelihood ratio is from 1, the stronger the evidence for or against the condition [2], and the only truly useless result is one with a likelihood ratio of 1 [3].
Why a straight line works: on the nomogram, the two probability axes are spaced on the log-odds (logit) scale and the likelihood ratio axis on a log scale. Taking logs turns "pre-test odds × LR" into a sum, which a ruler can add geometrically.
How to use the Fagan nomogram, step by step
- Estimate the pre-test probability for a patient like yours (see below for how).
- Get the likelihood ratio for the test result. If a study reports only sensitivity and specificity, calculate LR+ = sensitivity / (1 − specificity) and LR− = (1 − sensitivity) / specificity [2].
- Find the pre-test probability on the left axis and the likelihood ratio on the middle axis [4].
- Draw a straight line through the two points and extend it to the right-hand axis.
- Read the post-test probability where the line crosses the right-hand axis. For a negative result, repeat with LR−.
- Check your reading against the formula or a calculator; nomogram readings are approximate.
As a check of your reading: Deeks and Altman's example updates a prior probability of obstructive airway disease of 0.1 to about 0.7 for a smoking history of more than 40 pack-years, a result with a likelihood ratio of about 20 [2]. Calculated exactly, 10% with a likelihood ratio of 20.4 gives 69%.
Fagan nomogram worked example
Take a test with 90% sensitivity and 80% specificity used where 25% of the patients tested have the condition. These are the figures of the Cochrane diagnostic test accuracy handbook's own predictive-value example [6].
| Step | Positive result | Negative result |
|---|---|---|
| Likelihood ratio | LR+ = 0.90 / (1 − 0.80) = 4.5 | LR− = (1 − 0.90) / 0.80 = 0.125 |
| Pre-test odds | 0.25 / 0.75 = 0.333 | 0.25 / 0.75 = 0.333 |
| Post-test odds | 0.333 × 4.5 = 1.5 | 0.333 × 0.125 = 0.042 |
| Post-test probability | 1.5 / 2.5 = 60% | 0.042 / 1.042 = 4% |
The probability after a positive result is the positive predictive value, and the probability after a negative result is 1 minus the negative predictive value [6]. The Handbook reports the same values for this example: a positive predictive value of 0.6 and a negative predictive value of 0.96 [6].
The same example in natural frequencies
Presenting probabilities as frequencies has been shown to help readers understand them [6]. Out of 1000 people tested:
| Condition present (250) | Condition absent (750) | Total | |
|---|---|---|---|
| Test positive | 225 (true positives) | 150 (false positives) | 375: 225 of 375 = 60% have the condition |
| Test negative | 25 (false negatives) | 600 (true negatives) | 625: 25 of 625 = 4% have the condition |
The Handbook gives the same counts: 150 false positives and 25 false negatives for every 1000 people tested [6]. The nomogram and the frequency table are two routes to the same answer.
How to choose the pre-test probability
Bayes' theorem needs an idea of the prevalence of the condition among patients suspected of having it [7], and the choice changes the answer substantially. The same test can be decisive in one patient and nearly useless in another:
| Pre-test probability | After a positive result | After a negative result |
|---|---|---|
| 1% | 4.3% | 0.13% |
| 5% | 19.1% | 0.65% |
| 25% | 60.0% | 4.0% |
| 50% | 81.8% | 11.1% |
| 80% | 94.7% | 33.3% |
At a pre-test probability of 1%, a positive result still leaves the condition unlikely; at 80%, a negative result still leaves a one-in-three chance. The divergence between odds and probabilities matters especially for probabilities below 10% or above 90% [8].
Sources for the pre-test probability:
- The prevalence among similar patients in your own setting, the approach McGee uses in his worked examples [5].
- A validated clinical decision rule. Establishing the pre-test probability is one of the uses of clinical decision rules [9].
- External data such as disease registries, which may estimate prevalence more reliably than study samples [6].
- The prevalence in diagnostic accuracy studies, but only if they represent your setting, and never from case-control studies, whose prevalence is an artifact of the design [6].
- A range of plausible values, when you are unsure [6].
Be wary of intuition alone. In a survey of 553 US practitioners across four common primary care scenarios, the pre-test probability was overestimated in every scenario [10].
How to interpret likelihood ratios on the nomogram
Likelihood ratios above 10 and below 0.1 are considered strong evidence to rule a diagnosis in or out in most circumstances [2]. The JAMA Users' Guides give a fuller rule of thumb [11], quoted here as reproduced by Peirce and Gerkin [8]:
| LR+ | LR− | Change from pre-test to post-test probability |
|---|---|---|
| Above 10 | Below 0.1 | Large and often conclusive |
| 5 to 10 | 0.1 to 0.2 | Moderate |
| 2 to 5 | 0.2 to 0.5 | Small, but sometimes important |
| 1 to 2 | 0.5 to 1 | Small and rarely important |
Treat these bands as a guide, not a rule. Universal cutoffs have been criticized because the usefulness of a change depends on the pre-test probability: a rare disease needs a larger LR+ to rule it in, and a common one a smaller LR− to rule it out [6]. The Cochrane diagnostic test accuracy handbook also notes that evidence that likelihood ratios improve diagnostic decision making is lacking [6]. If a likelihood ratio's 95% confidence interval includes 1, the result is not statistically significant [5].
A bedside shortcut: McGee's rule
McGee showed that, for pre-test probabilities between 10% and 90%, you can estimate the change without a nomogram [5]:
| Likelihood ratio | Approximate change |
|---|---|
| 10 | +45 percentage points |
| 5 | +30 |
| 2 | +15 |
| 1 | No change |
| 0.5 | −15 |
| 0.2 | −30 |
| 0.1 | −45 |
These estimates are within 10 points of the calculated answer for pre-test probabilities from 10% to 90%, with an average error of 4%, provided estimates above 100% or below 0% are rounded to 100% or 0% [5]. For example, with a pre-test probability of 40%, a likelihood ratio of 2 gives about 55% by the rule and 57% exactly [5]. The rule is inaccurate below 10% or above 90% [5], so don't use it for screening, where the nomogram or a calculator is needed.
Tests with more than two results: multilevel likelihood ratios
Unlike sensitivity and specificity, likelihood ratios don't require test results to be dichotomized, and forcing a graded result into positive or negative can discard useful information [2]. When results are collapsed into two levels, the likelihood ratios move closer to 1 [12]. With three or more levels, each level has its own likelihood ratio, and the term "negative LR" no longer applies [5].
Richardson and colleagues illustrate this with serum ferritin for iron deficiency, using bone-marrow iron as the reference standard (85 patients with iron deficiency and 150 without) [12]. The likelihood ratios below were calculated from their counts, and the post-test probabilities assume a hypothetical pre-test probability of 30%:
| Ferritin (µg/L) | Iron deficient / not | Likelihood ratio | Post-test probability at 30% |
|---|---|---|---|
| ≤ 18 | 47 / 2 | 41.5 | 94.7% |
| 19 to 45 | 23 / 13 | 3.1 | 57.2% |
| 46 to 100 | 7 / 27 | 0.46 | 16.4% |
| > 100 | 8 / 108 | 0.13 | 5.3% |
| Dichotomized at 45: positive | 70 / 15 | 8.2 | 77.9% |
| Dichotomized at 45: negative | 15 / 135 | 0.20 | 7.8% |
A ferritin of 18 or less has a likelihood ratio of about 41, but the dichotomized test credits it with only 8.2. The published paper reports 42.5 for the lowest level because it divides rounded proportions; the unrounded value is 41.5. On the nomogram, use the likelihood ratio for the patient's actual result level.
Can you use the Fagan nomogram for several tests in a row?
Only with care. The post-test odds after one test can become the pre-test odds for the next, provided the tests are genuinely different and not variations of the same test [3]. Chaining findings that reflect the same abnormality, such as jaundice and scleral icterus, violates the statistical requirement that the tests operate independently [3].
The accuracy of a sequence of tests depends on each test's accuracy and on how dependent the tests are on each other given the true disease status [13]. Assuming independence is the simplest option, but when data on the correlation are lacking, Fanshawe and colleagues suggest trying low, moderate, and high levels of dependence [13]. There is no consensus on how best to combine several likelihood ratios into one post-test probability [14], and some tutorials give the product formula (pre-test odds × LR1 × LR2 × …) without stating the independence assumption [15].
In practice: chain two tests only when they measure different things, remember that chaining correlated tests is likely to overstate the change, and prefer a validated decision rule or a study of the test combination when one exists.
Uncertainty: confidence intervals and sensitivity analysis
A nomogram gives a single number, but both inputs are uncertain. Likelihood ratios are ratios of probabilities and can be given confidence intervals in the same way as risk ratios [2]. Those intervals are often wide, especially for the extreme likelihood ratios that rule a diagnosis in or out [15]. Methods also exist for confidence intervals around likelihood ratios for dichotomous, non-positive and non-negative, and ordinal results [16].
In Deeks and Altman's smoking example, the likelihood ratio of 20.4 has a 95% confidence interval of 5.04 to 82.8 [2]. From a pre-test probability of 10%, that range gives post-test probabilities from about 36% to 90% (calculated), compared with 69% for the point estimate. The single line on the nomogram hides that spread.
A confidence interval for the likelihood ratio captures only the uncertainty in the test's accuracy, not the uncertainty in the pre-test probability [6]. So do two checks: rerun the calculation with the lower and upper confidence limits of the likelihood ratio [6], and run a sensitivity analysis across several sensible pre-test probabilities [15].
Will a published likelihood ratio work in your setting?
The Fagan nomogram assumes the test's sensitivity and specificity, and so its likelihood ratios, stay the same whatever the prevalence [7]. They often don't. Across 23 meta-analyses including 416 studies, specificity tended to be lower where the disease was more common [7]. Accuracy estimated in one setting cannot unconditionally be transferred to a setting with a different prevalence [7].
Leeflang and colleagues give an example from studies of spiral CT for pulmonary embolism, where the positive likelihood ratio ranged from 2.35 to 25.4 across studies with prevalences of 25% to 82%. At a pre-test probability of 30%, a likelihood ratio of 18 gives a post-test probability of 89%, but the likelihood ratio of 6.2 from a study with 57% prevalence gives 73% [7]. Results from a study with high prevalence may not justify calculating post-test probabilities for patients with low pre-test probabilities [7].
Choose the study that most closely matches your setting, by the target condition, the patients included, prior testing, and the reported prevalence [7]. McGee gives another example: the same sign can have different likelihood ratios for the same disease in different clinical settings [5].
Using the Fagan nomogram with a diagnostic meta-analysis
A Fagan nomogram can show what the summary results of a diagnostic test accuracy review mean for patients. Take the inputs from the right model:
- Derive the likelihood ratios from the summary sensitivity and specificity of a hierarchical model, such as the bivariate model. Summary likelihood ratios and their confidence intervals can be derived at the summary point from these models [17].
- Don't pool LR+ and LR− separately. Separate pooling ignores the correlation between them and can in theory produce impossible estimates [17,18]. Zwinderman and Bossuyt advise meta-analyzing sensitivity and specificity instead [18].
- Don't pool predictive values, because they depend on prevalence: an average predictive value relates to some average, unknown prevalence [17].
- Show post-test probabilities across a range of plausible prevalences for the target setting, rather than at one value [6], and consider natural frequencies per 1000 people [6].
The quality of the included studies limits what any nomogram can claim, so assess them with QUADAS-2 or QUADAS-3. Summary sensitivity and specificity come from the bivariate meta-analysis that also produces the summary ROC plot; our SROC curve generator draws one, and our sensitivity and specificity calculator works out the accuracy measures for a single study's 2×2 table. For the review process as a whole, see how to do a systematic review.
Limitations and alternatives
- Likelihood ratios are often not reported. The nomogram's practicality is limited because many diagnostic accuracy studies don't report likelihood ratios [19]. Caraguel and Vanderstichel's two-step nomogram adds a first step that goes from sensitivity and specificity to the likelihood ratio, so a dichotomous result can be interpreted without calculation [19].
- Other non-electronic tools exist, such as a geometric ruler that gives predictive values directly from prevalence, sensitivity, and specificity [20], and McGee's bedside rule above [5].
- Reading errors. A printed nomogram is read by eye, so values in the steep tails are imprecise; use a calculator for the final number.
- The inputs carry the assumptions: a pre-test probability that fits your patients, accuracy estimates from a comparable setting, and independent tests if you chain them.
Common mistakes with the Fagan nomogram
- Reading the post-test probability off the wrong axis. It is on the right-hand axis [4].
- Typing sensitivity and specificity as proportions in a calculator that expects percentages, or swapping LR+ and LR−.
- Using the prevalence from a case-control study as the pre-test probability [6].
- Guessing the pre-test probability, which practitioners tend to overestimate [10].
- Treating the post-test probability after a negative result as the probability of being disease-free. It is the probability that the condition is still present, 1 minus the negative predictive value [6].
- Dichotomizing a graded test instead of using the likelihood ratio for the actual result [2,12].
- Chaining tests that measure the same thing [3].
- Ignoring the confidence interval of the likelihood ratio [15].
- Pooling likelihood ratios separately in a meta-analysis [18].
- Applying McGee's rule outside 10% to 90% [5].
Getting help with diagnostic accuracy evidence
If you are appraising diagnostic accuracy studies for a clinical question, turning summary estimates into post-test probabilities for practice, or planning a diagnostic test accuracy review, see our healthcare evidence synthesis service and systematic review service. Our PhD-led reviewers work alongside you, and you keep ownership of your question and conclusions.
Frequently asked questions
What is a Fagan nomogram used for?
To convert a pre-test probability and a likelihood ratio into a post-test probability without calculation. You draw a straight line from the pre-test probability on the left axis through the likelihood ratio on the middle axis and read the post-test probability on the right axis.
How do you calculate the post-test probability without a nomogram?
Convert the pre-test probability to odds (p / (1 − p)), multiply by the likelihood ratio, and convert back to a probability (odds / (1 + odds)). For example, 25% gives odds of 0.333; times an LR+ of 4.5 gives 1.5; and 1.5 / 2.5 is 60%.
How do I get likelihood ratios from sensitivity and specificity?
LR+ = sensitivity / (1 − specificity) and LR− = (1 − sensitivity) / specificity. A test with 90% sensitivity and 80% specificity has LR+ 4.5 and LR− 0.125.
What is a good likelihood ratio?
Likelihood ratios above 10 or below 0.1 are generally considered strong evidence; 5 to 10 and 0.1 to 0.2 give moderate shifts; 2 to 5 and 0.2 to 0.5 small but sometimes important ones; and 1 to 2 and 0.5 to 1 rarely important ones. How useful a change is still depends on the pre-test probability.
Where do I get the pre-test probability?
From the prevalence among similar patients in your setting, a validated clinical decision rule, or external data such as registries. If you use the prevalence in diagnostic accuracy studies, exclude case-control studies, and consider a range of plausible values.
Is the post-test probability the same as the predictive value?
After a positive result, the post-test probability is the positive predictive value at that pre-test probability. After a negative result, it is 1 minus the negative predictive value: the probability that the condition is still present.
Can I use the Fagan nomogram for two tests in a row?
Only if the tests are genuinely different and operate independently. Then the post-test probability after the first test becomes the pre-test probability for the second. Findings that reflect the same abnormality can't be chained this way.
Why do pre-test probability and setting matter so much?
The same likelihood ratio produces very different post-test probabilities at different starting points, and a test's sensitivity and specificity can themselves vary with the setting and prevalence. Use inputs from studies that match your patients.
Should a diagnostic meta-analysis pool likelihood ratios?
No. Derive the likelihood ratios from the summary sensitivity and specificity of a bivariate or other hierarchical model. Pooling LR+ and LR− separately ignores their correlation and can give impossible estimates.
References
- Fagan TJ. Nomogram for Bayes's theorem [letter]. N Engl J Med. 1975;293(5):257. doi:10.1056/NEJM197507312930513
- Deeks JJ, Altman DG. Diagnostic tests 4: likelihood ratios. BMJ. 2004;329(7458):168-9. doi:10.1136/bmj.329.7458.168
- Gill CJ, Sabin L, Schmid CH. Why clinicians are natural bayesians. BMJ. 2005;330(7499):1080-3. doi:10.1136/bmj.330.7499.1080
- Safari S, Baratloo A, Elfil M, Negida A. Evidence based emergency medicine; part 4: pre-test and post-test probabilities and Fagan's nomogram. Emerg (Tehran). 2016;4(1):48-51. Available from: https://pmc.ncbi.nlm.nih.gov/articles/PMC4744617/
- McGee S. Simplifying likelihood ratios. J Gen Intern Med. 2002;17(8):647-50. doi:10.1046/j.1525-1497.2002.10750.x
- Bossuyt P, Davenport C, Deeks J, Hyde C, Leeflang M, Scholten R. Chapter 11: interpreting results and drawing conclusions. In: Deeks JJ, Bossuyt PM, Gatsonis C, editors. Cochrane handbook for systematic reviews of diagnostic test accuracy. Version 0.9. The Cochrane Collaboration; 2013 [cited 2026 Nov 15]. Available from: https://methods.cochrane.org/sites/methods.cochrane.org.sdt/files/uploads/DTA%20Handbook%20Chapter%2011%20201312.pdf
- Leeflang MMG, Rutjes AWS, Reitsma JB, Hooft L, Bossuyt PMM. Variation of a test's sensitivity and specificity with disease prevalence. CMAJ. 2013;185(11):E537-E544. doi:10.1503/cmaj.121286
- Peirce JC, Gerkin RD. The likelihood ratio as one of--if not the most important--operating characteristic of a diagnostic test [letter]. J Gen Intern Med. 2003;18(1):74-5. doi:10.1046/j.1525-1497.2003.210503.x
- McGinn TG, Guyatt GH, Wyer PC, Naylor CD, Stiell IG, Richardson WS; Evidence-Based Medicine Working Group. Users' guides to the medical literature: XXII: how to use articles about clinical decision rules. JAMA. 2000;284(1):79-84. doi:10.1001/jama.284.1.79
- Morgan DJ, Pineles L, Owczarzak J, Magder L, Scherer L, Brown JP, et al. Accuracy of practitioner estimates of probability of diagnosis before and after testing. JAMA Intern Med. 2021;181(6):747-55. doi:10.1001/jamainternmed.2021.0269
- Jaeschke R, Guyatt GH, Sackett DL. Users' guides to the medical literature. III. How to use an article about a diagnostic test. B. What are the results and will they help me in caring for my patients? JAMA. 1994;271(9):703-7. doi:10.1001/jama.1994.03510330081039
- Richardson WS, Wilson MC, Keitz SA, Wyer PC; EBM Teaching Scripts Working Group. Tips for teachers of evidence-based medicine: making sense of diagnostic test results using likelihood ratios. J Gen Intern Med. 2008;23(1):87-92. doi:10.1007/s11606-007-0330-1
- Fanshawe TR, Nicholson BD, Perera R, Oke JL. A review of methods for the analysis of diagnostic tests performed in sequence. Diagn Progn Res. 2024;8(1):8. doi:10.1186/s41512-024-00175-3
- Ranganathan P, Aggarwal R. Understanding the properties of diagnostic tests - Part 2: likelihood ratios. Perspect Clin Res. 2018;9(2):99-102. doi:10.4103/picr.picr_41_18
- Parikh R, Parikh S, Arun E, Thomas R. Likelihood ratios: clinical application in day-to-day practice. Indian J Ophthalmol. 2009;57(3):217-21. doi:10.4103/0301-4738.49397
- Simel DL, Samsa GP, Matchar DB. Likelihood ratios with confidence: sample size estimation for diagnostic test studies. J Clin Epidemiol. 1991;44(8):763-70. doi:10.1016/0895-4356(91)90128-v90128-v)
- Macaskill P, Gatsonis C, Deeks JJ, Harbord RM, Takwoingi Y. Chapter 10: analysing and presenting results. In: Deeks JJ, Bossuyt PM, Gatsonis C, editors. Cochrane handbook for systematic reviews of diagnostic test accuracy. Version 1.0. The Cochrane Collaboration; 2010 [cited 2026 Nov 15]. Available from: https://methods.cochrane.org/sites/methods.cochrane.org.sdt/files/uploads/Chapter%2010%20-%20Version%201.0.pdf
- Zwinderman AH, Bossuyt PM. We should not pool diagnostic likelihood ratios in systematic reviews. Stat Med. 2008;27(5):687-97. doi:10.1002/sim.2992
- Caraguel CGB, Vanderstichel R. The two-step Fagan's nomogram: ad hoc interpretation of a diagnostic test result without calculation. Evid Based Med. 2013;18(4):125-8. doi:10.1136/eb-2013-101243
- Herich L, Lehmacher W, Hellmich M. Drop the likelihood ratio. A novel non-electronic tool for interpreting diagnostic test results. Methods Inf Med. 2015;54(3):283-7. doi:10.3414/ME14-01-0091