
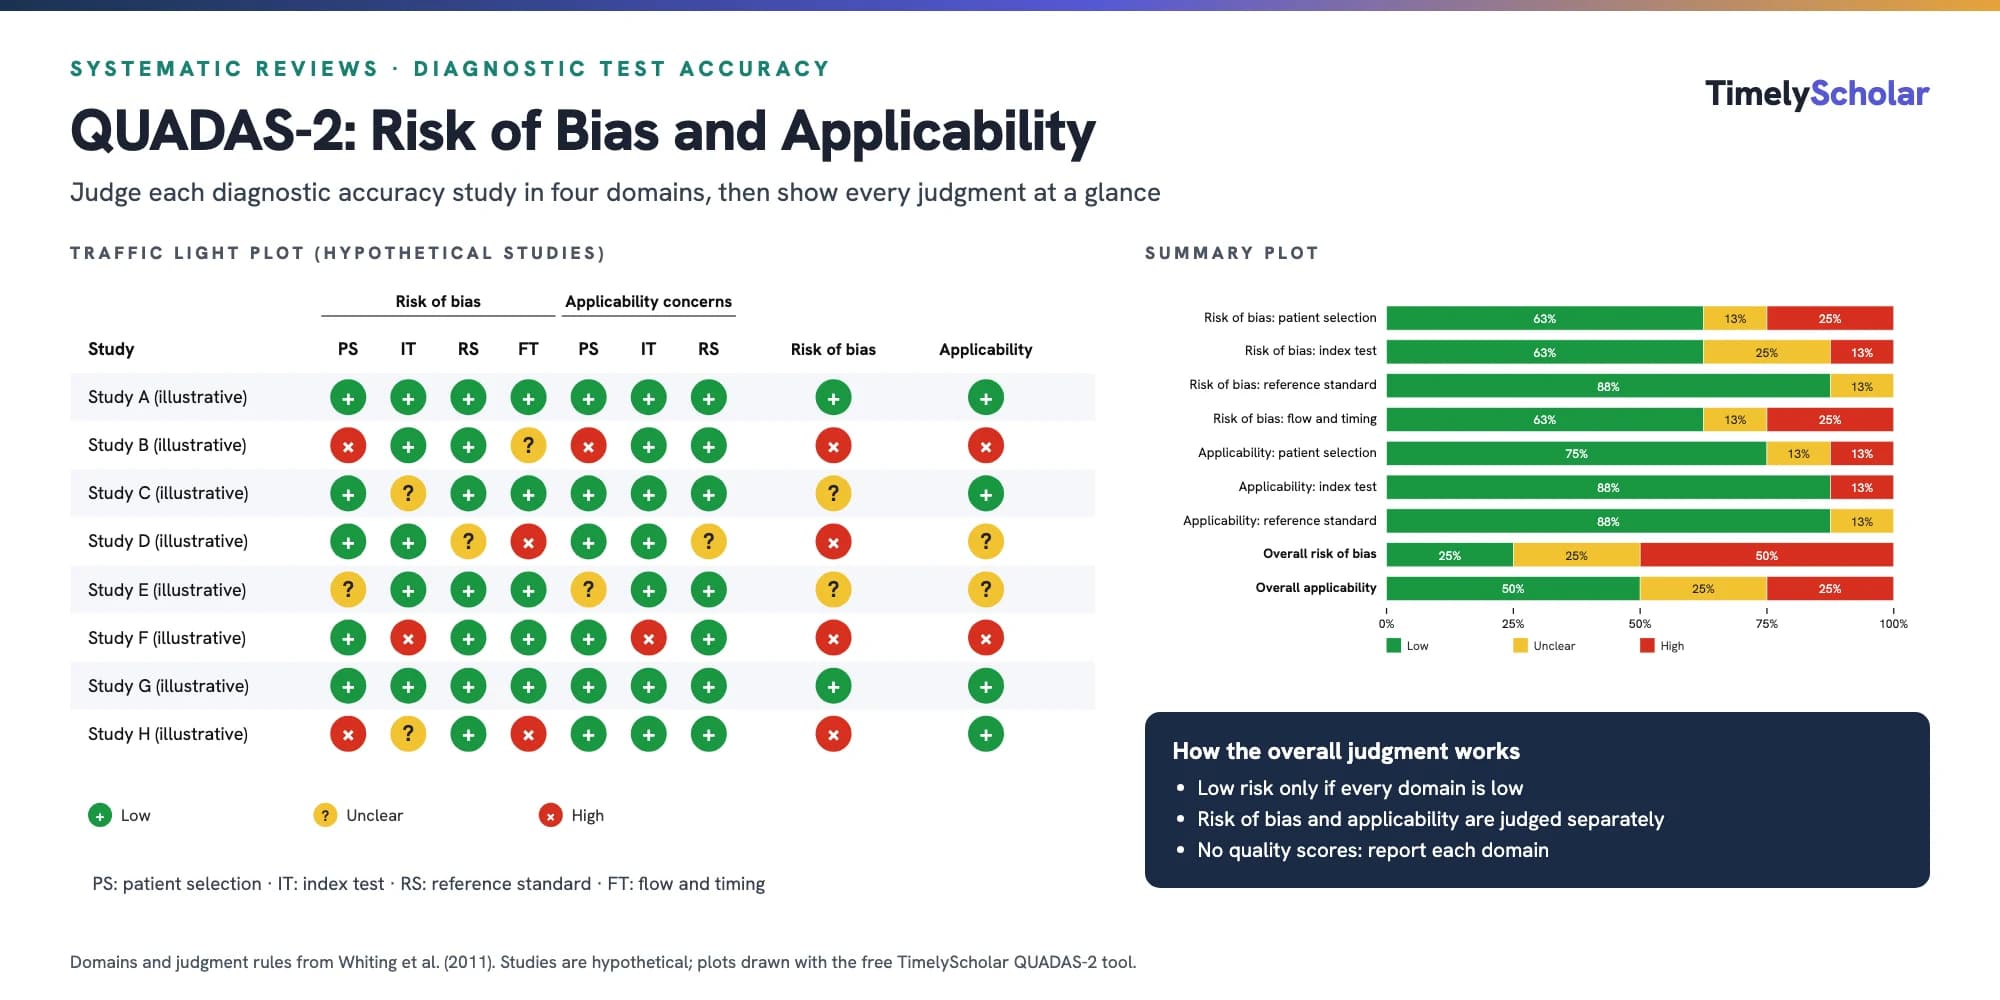
QUADAS-2 is the most widely used tool for assessing the risk of bias and applicability of diagnostic accuracy studies in a systematic review [1]. It covers four domains: patient selection, index test, reference standard, and flow and timing. Each domain is rated low, high or unclear risk of bias, guided by signaling questions answered yes, no or unclear. The first three domains are also rated for concerns about applicability to your review question. A study is at low risk of bias overall only if every domain is low. QUADAS-2 gives no numerical score. Two reviewers should assess each study independently, and the results are presented in a table or a traffic light plot. In 2026 the developers released QUADAS-3, now their recommended version, but a modified QUADAS-2 is still the standard in Cochrane diagnostic test accuracy reviews [2,3].
Working on a systematic review? A PhD-led reviewer can help at any stage. Get a free quote →
What is QUADAS-2?
QUADAS stands for Quality Assessment of Diagnostic Accuracy Studies. A diagnostic test accuracy (DTA) study compares an index test (the test being evaluated) with a reference standard (the best available way of establishing whether the target condition is present). From the resulting 2×2 table, it estimates sensitivity, specificity and related measures. Because flaws in how such studies recruit patients, run the tests, or analyze the results can make a test look more or less accurate than it really is, every DTA review needs a structured way to judge each study.
The original QUADAS tool was published in 2003. Its revision, QUADAS-2, followed in 2011 and introduced the structure most reviewers know today: four key domains, signaling questions to support judgments, and separate ratings for risk of bias and applicability [1]. A modified QUADAS-2 is recommended for all Cochrane DTA reviews, and QUADAS has also been recommended by NICE, AHRQ and other health technology assessment organizations [3,4].
QUADAS-2 is used to assess primary studies of a single test's accuracy for diagnosis, screening or staging. It is not designed for studies that compare two tests (use QUADAS-C), for prediction models (use PROBAST) or for randomized trials of test-and-treat strategies (use RoB 2). Choosing the wrong tool is one of the most common mistakes examiners pick up.
The four QUADAS-2 domains at a glance
Each domain has a description section (what the study did), signaling questions, and a judgment. The table summarizes the signaling questions from Whiting et al. [1] in brief; use the official tool for the full wording.
| Domain | Signaling questions (yes/no/unclear) | Applicability concern? |
|---|---|---|
| 1. Patient selection | Was a consecutive or random sample enrolled? Was a case-control design avoided? Did the study avoid inappropriate exclusions? | Do the included patients and setting match the review question? |
| 2. Index test | Were index test results interpreted without knowledge of the reference standard results? If a threshold was used, was it pre-specified? | Do the test, its conduct, or its interpretation differ from the review question? |
| 3. Reference standard | Is the reference standard likely to classify the target condition correctly? Were its results interpreted without knowledge of the index test results? | Does the target condition, as defined by the reference standard, match the review question? |
| 4. Flow and timing | Was the interval between index test and reference standard appropriate? Did all patients receive a reference standard? Did all receive the same reference standard? Were all patients included in the analysis? | Not assessed |
Answering yes to every signaling question in a domain usually means low risk of bias. A no flags that bias is possible, and you then judge how serious it is. Unclear is reserved for studies that do not report enough to decide, which is why reporting quality (judged against STARD 2015 [5]) strongly affects QUADAS-2 results.
How to use QUADAS-2: the four phases
Whiting et al. [1] describe four phases. Many reviewers skip straight to phase 4, which is why their judgments are inconsistent.
- State the review question in terms of patients, index test(s), reference standard, and target condition. Applicability is judged against this, so it must be specific.
- Tailor the tool and write review-specific guidance. Decide whether any signaling questions do not apply, add any your topic needs, and set rules such as what counts as an acceptable reference standard, an appropriate interval between tests, or a pre-specified threshold. Pilot the guidance on a few studies, ideally including ones you expect to be problematic.
- Draw a flow diagram for each primary study showing how many patients were enrolled, how many received each test, and how many were analyzed. Missing or inconsistent numbers usually reveal flow and timing problems.
- Make the judgments: answer the signaling questions, rate risk of bias for all four domains and applicability for the first three, and record the reason for each judgment in a sentence or two.
Two reviewers should complete the assessment independently and resolve disagreements by discussion or with a third reviewer, as for other risk-of-bias assessments. Reporting agreement before consensus (for example with Cohen's kappa) is not required, but many supervisors and journals appreciate it.
Domain-by-domain guide with examples of high risk of bias
Domain 1: patient selection
This domain asks whether the way patients were chosen could distort accuracy. The biggest warning sign is a diagnostic case-control design: comparing people known to have severe disease with healthy volunteers exaggerates the difference between groups and inflates both sensitivity and specificity, because the difficult, borderline patients met in practice are missing. Excluding patients who are hard to diagnose (for example, those with previous treatment or co-morbidities) has a similar effect.
Low risk: consecutive adults presenting to the emergency department with suspected pulmonary embolism, with no exclusions beyond inability to consent.
High risk: 50 patients with confirmed disease from a specialist clinic compared with 50 healthy blood donors.
Applicability concern: a review of primary care screening that includes a study done only in tertiary referral patients.
Domain 2: index test
Bias arises when whoever reads the index test already knows the reference standard result, or when the positivity threshold is chosen after looking at the data (for example, the cut-off that maximized the Youden index in that sample). Data-driven thresholds overestimate accuracy, especially in small studies. For subjective tests, such as imaging read by a radiologist, blinding matters more than for automated laboratory tests.
Domain 3: reference standard
An imperfect reference standard misclassifies some patients and biases accuracy estimates. Reviewers should agree in phase 2 which reference standards are acceptable. Watch also for incorporation bias, where the index test result forms part of the reference standard, and for reference standards interpreted with knowledge of the index test.
Domain 4: flow and timing
This domain catches problems with who got which test and when. Common examples include long delays between tests, during which the condition could change (disease progression bias). Another is partial verification, where only some patients, often those with a positive index test, receive the reference standard. Differential verification is when test-positive and test-negative patients are verified with different reference standards. Exclusions from the analysis, such as dropping indeterminate results, also count here. Your study flow diagram from phase 3 is the quickest way to spot them.
How to judge overall risk of bias and applicability
QUADAS-2 rates risk of bias and applicability separately; never merge them. Whiting et al. [1] suggest this rule for an overall judgment:
- Low risk of bias (or low concern about applicability) when the study is rated low in every relevant domain.
- At risk of bias (or with applicability concerns) when one or more domains are rated high or unclear. Many reviews then report the most severe rating, as our tool does by default.
Do not add up yes answers or domains into a quality score. Scores give equal weight to problems of very different importance and hide which bias is present. QUADAS-2 was deliberately designed to produce domain judgments, not a number [1].
Hypothetical study: point-of-care ultrasound for appendicitis in 220 children, against histology or 14-day follow-up.
Patient selection: consecutive children with suspected appendicitis → low risk; applicability low.
Index test: sonographers blind to final diagnosis, criteria set in advance → low risk; applicability low.
Reference standard: histology if operated, telephone follow-up if not → unclear risk (follow-up may miss resolved cases); applicability low.
Flow and timing: children with a negative scan got follow-up, positives got histology (differential verification) → high risk.
Overall: at high risk of bias; low concern about applicability.
Presenting QUADAS-2 results: tables and traffic light plots
Most reviews report QUADAS-2 in two ways. The first is a table with one row per study and a column for each of the seven ratings (four risk of bias, three applicability), with the reasons in a supplementary file. The second is a pair of figures: a traffic light plot of every study's ratings, and a summary bar chart showing the proportion of studies at low, high, and unclear risk in each domain. These figures are produced by the robvis package [6] and by our QUADAS-2 tool, which also imports and exports CSV files.
Then use the judgments; don't just display them. Common approaches are to stratify results by risk of bias, run a sensitivity analysis excluding studies at high risk (see leave-one-out sensitivity analysis), or explore a domain such as case-control design as a source of heterogeneity in the bivariate meta-analysis. When you grade the certainty of the evidence, QUADAS-2 judgments feed the GRADE risk of bias and indirectness domains for test accuracy [7]. Our GRADE evidence rating tool helps you record that step.
For reporting, PRISMA-DTA asks you to describe the methods used to assess risk of bias and applicability and to present the results for each study [8]. If you are pooling accuracy estimates, our sensitivity and specificity calculator and SROC curve generator help with the next steps, and our guide to how to do a systematic review covers the full process.
QUADAS-2 vs QUADAS-3: what changed and which should you use?
QUADAS-3 was published in February 2026 after multistage piloting [2,9]. The developers now describe it as the current recommended version of QUADAS [4]. The main changes are:
- Assessment at the estimate level, not the study level: a study reporting accuracy at several thresholds or in several subgroups can receive different judgments for each estimate.
- The ideal test accuracy trial: reviewers first define the ideal study for each synthesis question, which focuses the risk-of-bias and applicability judgments.
- Six phases: define the synthesis question, define the ideal trial, draw a flow diagram, identify the estimates to assess, assess risk of bias and applicability, and make an overall judgment.
- Four domains renamed and revised: Participants, Index Test, Target Condition and Analysis, which replace Flow and Timing. The first three are also assessed for applicability.
- A formal overall judgment and space to record the rationale for each judgment.
Which should you use? Follow your registered protocol and your institution's or journal's guidance. QUADAS-2 is still the right choice for an ongoing review that specified it, for updates of earlier reviews, for coursework that names it, and for Cochrane DTA reviews following the current Handbook [3]. For a new review starting now, consider QUADAS-3 and its explanation and elaboration paper [10]. Whichever you choose, name the version and cite it.
QUADAS-2 vs QUADAS-C, PROBAST and RoB 2
| Tool | Use it for | Domains | Applicability rated? |
|---|---|---|---|
| QUADAS-2 (2011) | Single-test diagnostic accuracy studies | Patient selection, index test, reference standard, flow and timing | Yes (first three domains) |
| QUADAS-3 (2026) | Diagnostic accuracy estimates (current recommended version) | Participants, index test, target condition, analysis | Yes (first three domains) |
| QUADAS-C (2021) | Studies comparing the accuracy of two or more tests; used alongside QUADAS | Same domains plus comparison-specific questions | No |
| PROBAST (2019) / PROBAST+AI (2025) | Diagnostic or prognostic prediction models | Participants, predictors, outcome, analysis | Yes |
| RoB 2 | Randomized trials, including trials of test-and-treat strategies | Five domains of trial bias | No |
QUADAS-C assesses bias in the test comparison within a study, such as patients receiving one test but not the other, and must be used alongside the main QUADAS tool. It does not cover comparisons made between separate studies [11]. PROBAST is for studies that develop or validate multivariable prediction models. Its update, PROBAST+AI, covers models built with machine learning [12,13]. For diagnostic accuracy studies of AI systems, a dedicated QUADAS-AI extension is in development [14]; until it is published, use QUADAS-2 or QUADAS-3 with review-specific signaling questions on things like training and test data overlap. For randomized trials, use our RoB 2 tool.
Common QUADAS-2 mistakes (and how to avoid them)
- Skipping tailoring (phase 2). Without agreed rules on acceptable reference standards and intervals, two reviewers will disagree for reasons that have nothing to do with the studies.
- Merging risk of bias and applicability into one rating, or rating applicability for flow and timing.
- Calculating a total score or a percentage of yes answers.
- Treating 'unclear' as 'low' to keep studies in the main analysis. Report it as unclear and explore it.
- Using QUADAS-2 for comparative accuracy or prediction model studies instead of QUADAS-C or PROBAST.
- Judging reporting instead of conduct. A poorly written paper is unclear, not automatically high risk.
- Giving no reasons. Every rating should have a sentence explaining it, with supporting quotes in a supplementary table.
- Not using the results in the synthesis, discussion or GRADE assessment.
QUADAS-2 template and table layout
A QUADAS-2 template in Excel or Word needs one row per study (or per estimate, if you follow QUADAS-3). Use these columns: study ID; the answers to each signaling question with a supporting quote; the risk of bias judgment for each of the four domains; applicability for the first three; the overall judgments; and the reviewer's initials. Keep each reviewer's version separate until consensus. Our QUADAS-2 tool exports and imports this as CSV, accepting wording such as "Low risk" or "Unclear" from Excel templates and robvis files. It draws the traffic light and summary plots for you.
Getting help with your diagnostic accuracy review
If you would like a second, independent QUADAS-2 or QUADAS-3 reviewer, help tailoring the signaling questions, or support with a bivariate meta-analysis and PRISMA-DTA write-up, see our systematic review service. Our PhD-led reviewers work alongside you, and you keep ownership of your question and conclusions.
Frequently asked questions
What is QUADAS-2 used for?
QUADAS-2 assesses the risk of bias and the applicability of primary diagnostic accuracy studies included in a systematic review, across four domains: patient selection, index test, reference standard, and flow and timing.
What are the four domains of QUADAS-2?
Patient selection, index test, reference standard, and flow and timing. All four are rated for risk of bias, and the first three are also rated for concerns about applicability.
How do you score QUADAS-2?
You don't. Each domain is judged low, high or unclear risk of bias, guided by signaling questions answered yes, no or unclear. A study is low risk overall only if every domain is low. Summing items into a score is not recommended.
What is the difference between risk of bias and applicability in QUADAS-2?
Risk of bias asks whether flaws in the study could have distorted its accuracy estimates. Applicability asks whether the study's patients, test or target condition match your review question, even if it was done well.
What is the difference between QUADAS-2 and QUADAS-3?
QUADAS-3 (2026) assesses each accuracy estimate rather than the whole study, introduces the ideal test accuracy trial, has six phases, replaces flow and timing with an analysis domain, and adds a formal overall judgment.
Is QUADAS-2 still valid?
Yes. QUADAS-2 remains the most widely used tool and a modified version is recommended in the Cochrane DTA Handbook. Its developers now recommend QUADAS-3 for new reviews, so follow your protocol and cite the version you use.
What is QUADAS-C?
An extension for studies that compare the accuracy of two or more index tests. It assesses bias in the comparison itself, must be used alongside QUADAS, and does not rate applicability.
How do you make a QUADAS-2 traffic light plot?
Enter each study's domain judgments into a tool such as our free QUADAS-2 tool or the robvis R package, which draws a traffic light plot of every study and a summary bar chart by domain.
References
- Whiting PF, Rutjes AWS, Westwood ME, Mallett S, Deeks JJ, Reitsma JB, et al. QUADAS-2: a revised tool for the quality assessment of diagnostic accuracy studies. Ann Intern Med. 2011;155(8):529-36. doi:10.7326/0003-4819-155-8-201110180-00009
- Whiting PF, Tomlinson E, Rutjes AWS, Davenport CF, Yang B, Westwood ME, et al. QUADAS-3: a revised tool for the quality assessment of diagnostic test accuracy studies. Ann Intern Med. 2026;179(4):548-55. doi:10.7326/ANNALS-25-02104
- Reitsma JB, Rutjes AW, Whiting P, Yang B, Leeflang MM, Bossuyt PM, et al. Assessing risk of bias and applicability. In: Deeks JJ, Bossuyt PM, Leeflang MMG, Takwoingi Y, editors. Cochrane handbook for systematic reviews of diagnostic test accuracy. Version 2.0. Chichester (UK): Wiley; 2023. p. 169-201. doi:10.1002/9781119756194.ch8
- University of Bristol. QUADAS [Internet]. Bristol (UK): University of Bristol; [date unknown] [cited 2026 Oct 19]. Available from: https://www.bristol.ac.uk/population-health-sciences/projects/quadas/
- Bossuyt PM, Reitsma JB, Bruns DE, Gatsonis CA, Glasziou PP, Irwig L, et al. STARD 2015: an updated list of essential items for reporting diagnostic accuracy studies. BMJ. 2015;351:h5527. doi:10.1136/bmj.h5527
- McGuinness LA, Higgins JPT. Risk-of-bias VISualization (robvis): an R package and Shiny web app for visualizing risk-of-bias assessments. Res Synth Methods. 2021;12(1):55-61. doi:10.1002/jrsm.1411
- Schünemann HJ, Mustafa RA, Brozek J, Steingart KR, Leeflang M, Murad MH, et al. GRADE guidelines: 21 part 1. Study design, risk of bias, and indirectness in rating the certainty across a body of evidence for test accuracy. J Clin Epidemiol. 2020;122:129-41. doi:10.1016/j.jclinepi.2019.12.020
- McInnes MDF, Moher D, Thombs BD, McGrath TA, Bossuyt PM, Clifford T, et al. Preferred reporting items for a systematic review and meta-analysis of diagnostic test accuracy studies: the PRISMA-DTA statement. JAMA. 2018;319(4):388-96. doi:10.1001/jama.2017.19163
- Tomlinson E, Yang B, Davenport CF, Rutjes AWS, Mallett S, Whiting PF. Piloting QUADAS-3: a revised tool for the quality assessment of diagnostic accuracy studies. J Clin Epidemiol. 2025;188:111983. doi:10.1016/j.jclinepi.2025.111983
- Davenport CF, Rutjes AWS, Mallett S, Tomlinson E, Yang B, Holmes J, et al. QUADAS-3 explanation and elaboration: guidance for quality assessment of diagnostic test accuracy studies. Ann Intern Med. 2026;179(4):e2504943. doi:10.7326/ANNALS-25-04943
- Yang B, Mallett S, Takwoingi Y, Davenport CF, Hyde CJ, Whiting PF, et al. QUADAS-C: a tool for assessing risk of bias in comparative diagnostic accuracy studies. Ann Intern Med. 2021;174(11):1592-9. doi:10.7326/M21-2234
- Wolff RF, Moons KGM, Riley RD, Whiting PF, Westwood M, Collins GS, et al. PROBAST: a tool to assess the risk of bias and applicability of prediction model studies. Ann Intern Med. 2019;170(1):51-8. doi:10.7326/M18-1376
- Moons KGM, Damen JAA, Kaul T, Hooft L, Andaur Navarro C, Dhiman P, et al. PROBAST+AI: an updated quality, risk of bias, and applicability assessment tool for prediction models using regression or artificial intelligence methods. BMJ. 2025;388:e082505. doi:10.1136/bmj-2024-082505
- Guni A, Sounderajah V, Whiting P, Bossuyt P, Darzi A, Ashrafian H. Revised tool for the quality assessment of diagnostic accuracy studies using AI (QUADAS-AI): protocol for a qualitative study. JMIR Res Protoc. 2024;13:e58202. doi:10.2196/58202

James has 7 years of experience in epidemiology, clinical research, public health, and evidence-based healthcare. He supports researchers and healthcare professionals through the whole evidence synthesis process, from refining a question and planning a protocol to reporting the results. Areas of expertise Systematic…