 TimelyScholar
Services › Meta-Analysis
Statistically rigorous meta-analysis in R, RevMan or Stata, from effect-size calculation to forest plots, heterogeneity and publication-bias assessment.
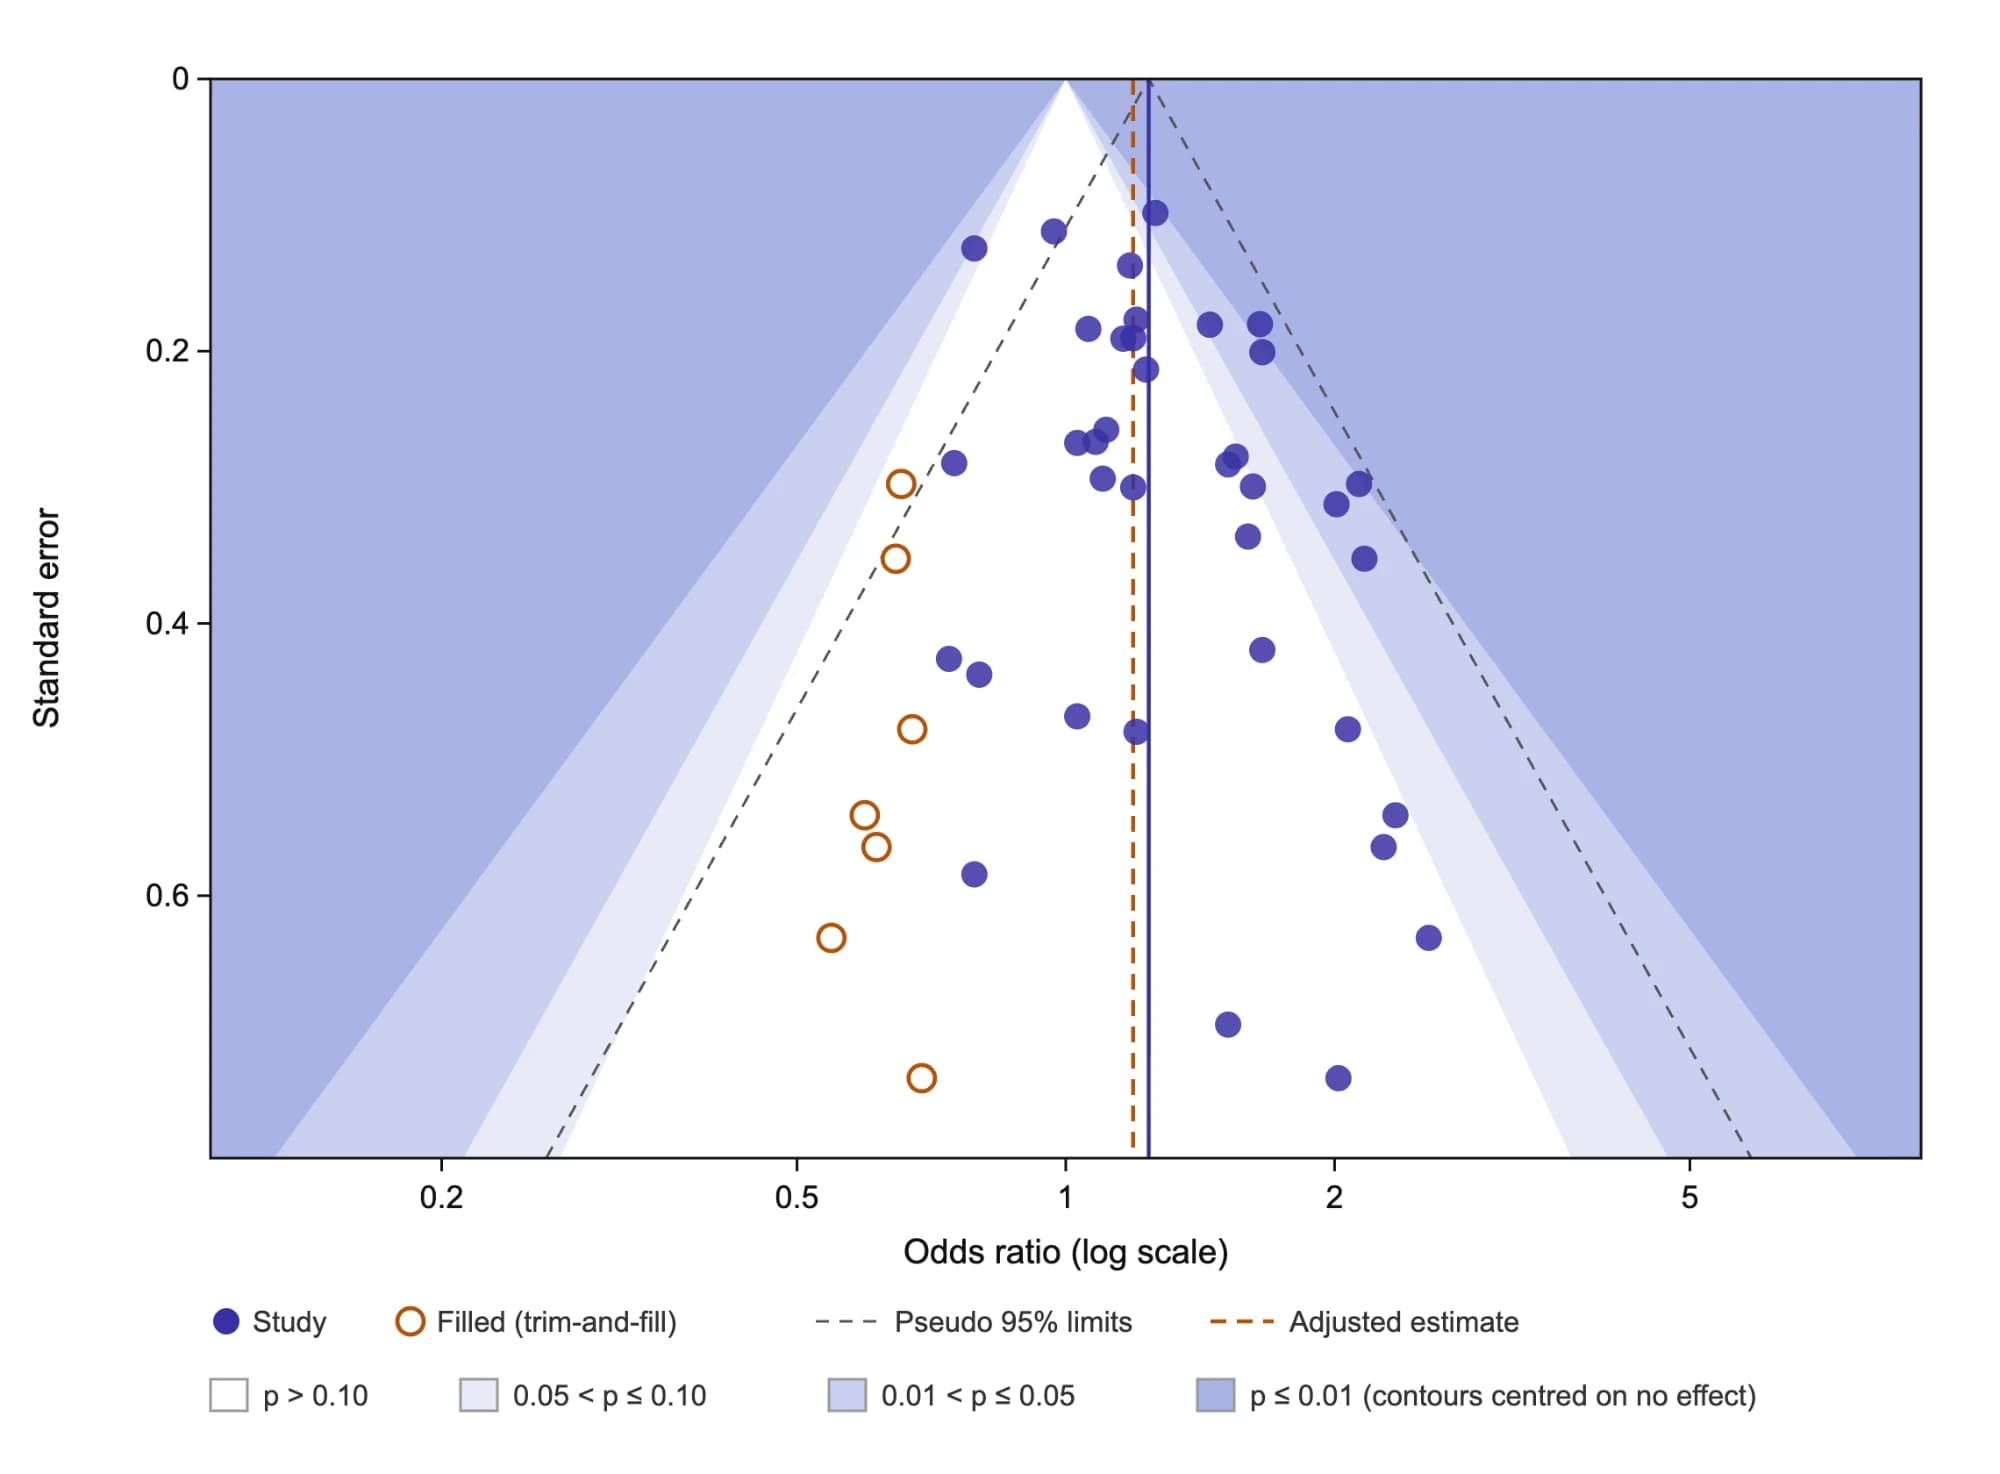
A meta-analysis statistically combines results from comparable studies to estimate an overall effect and explore why results differ. Done well, it follows the methods in Chapter 10 of the Cochrane Handbook, from choosing effect measures to fixed-effect or random-effects models.
We calculate and pool effect sizes (odds ratios, risk ratios, mean differences, standardised mean differences, proportions and correlations), produce forest plots, quantify heterogeneity with I², and run subgroup, sensitivity and publication-bias analyses.
You receive reproducible analysis files and a plain-language interpretation you can use in your results and discussion sections.
Extracting and converting study results into a common effect measure, with correct handling of multi-arm and crossover studies.
Publication-quality forest plots showing each study's estimate, weights and the pooled result.
I², tau² and the chi² test, interpreted using the Cochrane Handbook's guidance rather than fixed cut-offs.
The model chosen and justified for your data and question.
Pre-specified analyses that explore sources of heterogeneity.
Testing how robust the result is, for example by excluding high risk-of-bias studies.
Funnel plots and asymmetry tests such as Egger's test, when there are enough studies to use them.
A careful judgement of missing evidence, following Chapter 13 of the Cochrane Handbook.
Analyses in Cochrane's RevMan, ideal for Cochrane-style reviews.
Scripted, fully reproducible analyses in R, including network and advanced models.
Meta-analysis using Stata's meta suite when your team works in Stata.
We check the extracted data and agree the outcomes, effect measures and model.
We confirm the pre-specified subgroup, sensitivity and bias analyses.
We pool results, quantify heterogeneity and produce the plots.
We explain what the pooled estimate and heterogeneity mean for your question.
You receive the figures, tables, code or RevMan file and a written results section.
Our methods follow published standards from recognised authorities, so your work holds up to supervisors, examiners and peer reviewers.
| Standard | What it covers | Source |
|---|---|---|
| Cochrane Handbook, Chapter 10 | Effect measures, fixed-effect and random-effects models, heterogeneity | Cochrane Handbook, Chapter 10: Analysing data and undertaking meta-analyses |
| I² statistic | Quantifying inconsistency across studies | Higgins JPT, et al. Measuring inconsistency in meta-analyses. BMJ 2003;327:557-560 |
| Cochrane Handbook, Chapter 13 | Missing evidence; funnel-plot tests only with at least 10 studies | Cochrane Handbook, Chapter 13: Assessing risk of bias due to missing evidence |
| Egger's test | Graphical and statistical test for small-study effects | Egger M, et al. Bias in meta-analysis detected by a simple, graphical test. BMJ 1997;315:629-634 |
| Software | RevMan and the metafor package for R | RevMan (Cochrane's review software)Viechtbauer W. Conducting meta-analyses in R with the metafor package. J Stat Softw 2010;36(3) |
| PRISMA 2020 | Reporting the synthesis methods and results | Page MJ, et al. The PRISMA 2020 statement. BMJ 2021;372:n71 |
I² describes the percentage of variability in effect estimates that is due to heterogeneity rather than chance. The Cochrane Handbook gives overlapping ranges (for example 0-40% might not be important and 75-100% is considerable) and advises interpreting them in context.
It depends on whether you expect the studies to share one true effect. We choose and justify the model using the Cochrane Handbook's guidance.
The Cochrane Handbook advises using funnel-plot asymmetry tests only when a meta-analysis includes at least 10 studies, because the tests have low power with fewer.
Yes. We work in RevMan, R (metafor and meta) and Stata, and give you the files.
Yes. We use appropriate transformations and models for proportions and single-arm data.
Yes. Your files are stored privately and only the people working on your project can open them. We sign a non-disclosure agreement on request.
Yes. After delivery you can request refinements within the agreed scope directly from your client dashboard.
Every project gets an itemised quote based on scope, complexity and deadline. You pay only after you accept the quote.
Request a free quote online, message us on WhatsApp or email us. A specialist will reply with an itemised quote within 2-4 business hours.
You remain the author. For publications, the ICMJE recommends acknowledging writing assistance and editing rather than listing it as authorship. For coursework, follow your institution's academic integrity policy.
Describe your project and a specialist will reply with an itemized quote within 2-4 business hours.
Prefer email? info@timelyscholar.com