 TimelyScholar
Services › Statistical Data Analysis
Statistical analysis for dissertations, theses and research in SPSS, R, Stata, Python and Excel, with results written up to APA and journal standards.
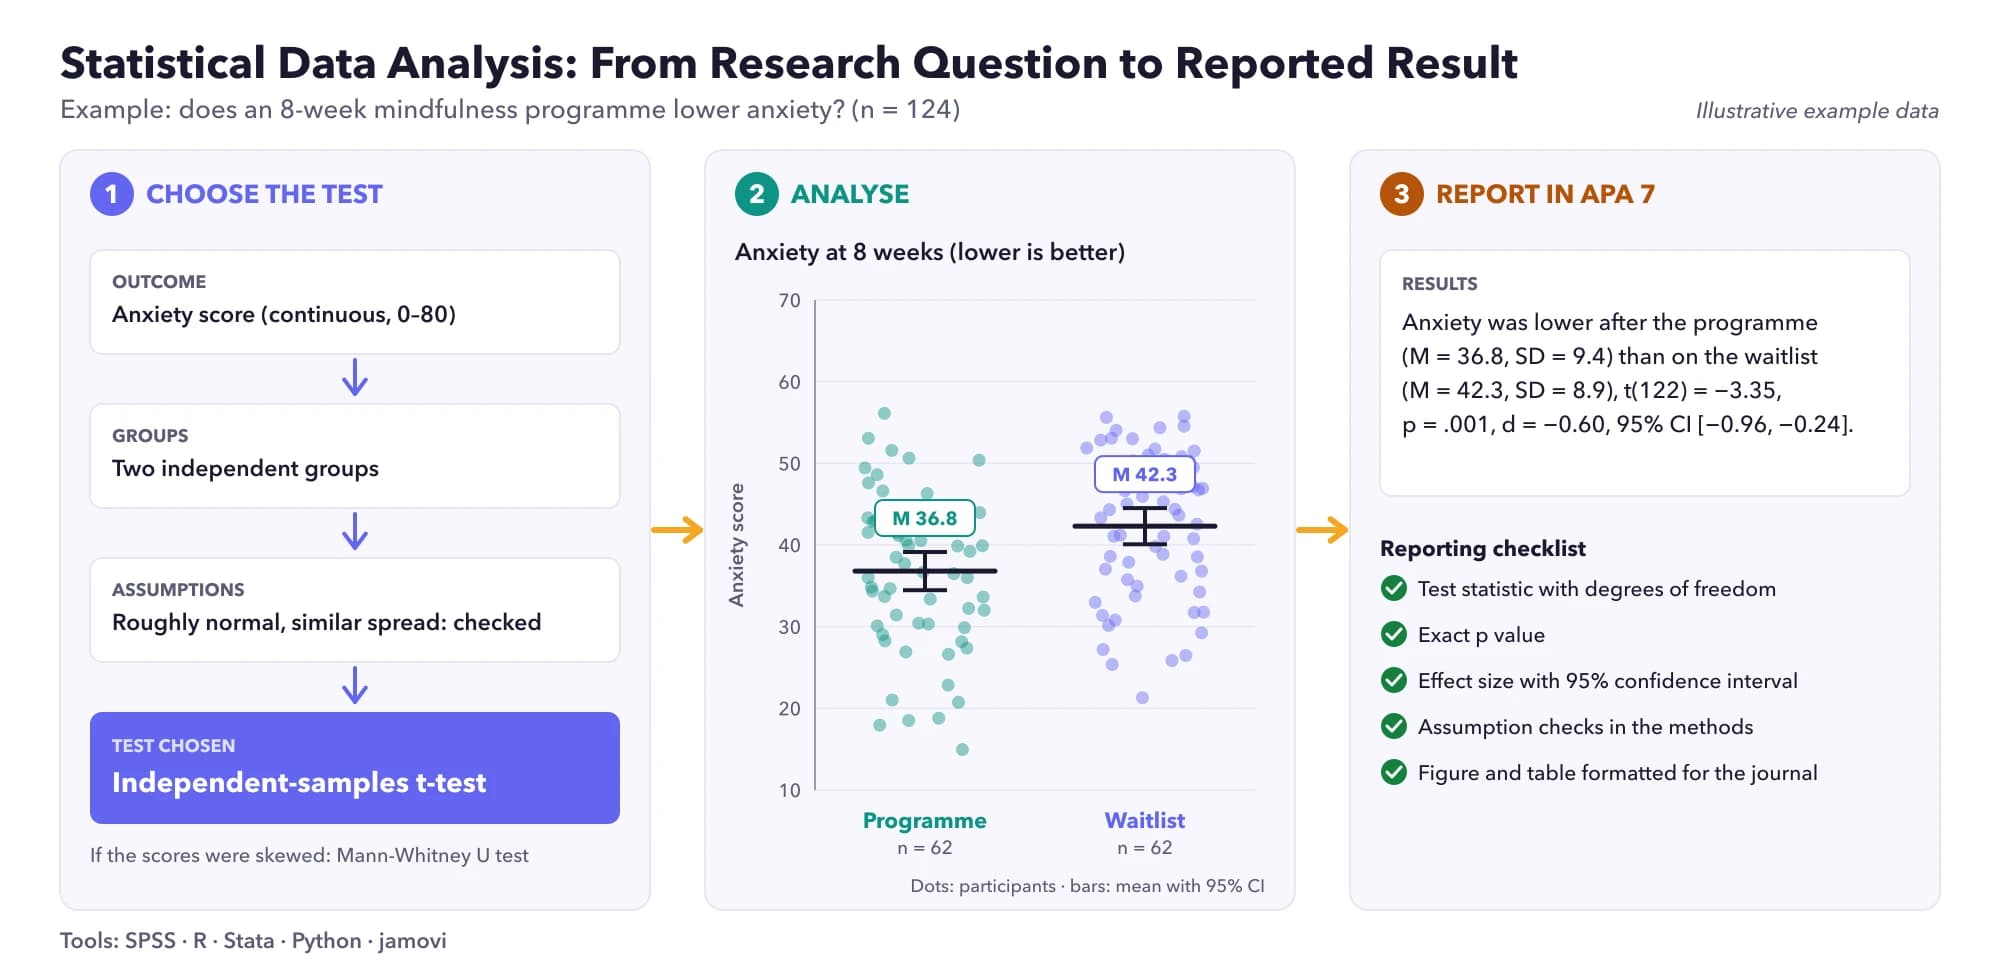
Choosing the right test, checking its assumptions and reporting it correctly matter as much as running the analysis. We work as your statistician: we review your research questions and data, select appropriate methods and explain the results in plain language.
We clean and prepare your data, run descriptive and inferential statistics (t-tests, ANOVA, chi-square, correlation, linear and logistic regression, survival analysis) and report results in APA style or to the relevant reporting guideline, such as STROBE for observational studies or CONSORT 2025 for randomised trials.
Checking, recoding and preparing data, with missing values handled transparently.
Summary tables of means, medians, frequencies and distributions.
Independent and paired t-tests, or non-parametric alternatives when assumptions fail.
One-way, factorial and repeated-measures ANOVA with post-hoc tests.
Tests of association for categorical data, including Fisher's exact test.
Pearson and Spearman correlation with interpretation.
Multiple regression with assumption checks and diagnostics.
Binary and multinomial logistic regression with odds ratios.
Kaplan-Meier curves and Cox proportional hazards models.
Analysis and annotated output in SPSS.
Reproducible scripts in R.
Analysis and do-files in Stata.
Analysis in Python (pandas, statsmodels, SciPy).
Analysis and clear tables in Excel when that is what you need.
Plain-language explanation of what each result means.
APA-formatted results sections, tables and figures.
We check your research questions, variables and dataset.
We agree the tests and software before we start.
We clean the data, check assumptions and run the analyses.
We write up results with tables and figures.
We explain the output so you can present and defend it.
Our methods follow published standards from recognised authorities, so your work holds up to supervisors, examiners and peer reviewers.
| Standard | What it covers | Source |
|---|---|---|
| APA JARS-Quant | Reporting standards for quantitative research | Appelbaum M, et al. APA Journal Article Reporting Standards for quantitative research. Am Psychol 2018;73:3-25 |
| STROBE | Reporting observational studies | von Elm E, et al. The STROBE statement. Lancet 2007;370:1453-1457 |
| CONSORT 2025 | Reporting randomised trials | Hopewell S, et al. CONSORT 2025 statement. BMJ 2025;389:e081123 |
| EQUATOR Network | Reporting guidelines for other study designs | EQUATOR Network: library of health research reporting guidelines |
Yes. We plan and run the analysis, write the results and explain them so you can present and defend your work.
It depends on your question, your variables and your design. We recommend the test and explain why, checking its assumptions first.
Yes, and also Python and Excel. You receive the output and the syntax or scripts.
Yes. We follow APA JARS and your institution's formatting requirements.
Yes, with a power analysis before data collection.
Yes. Your files are stored privately and only the people working on your project can open them. We sign a non-disclosure agreement on request.
Yes. After delivery you can request refinements within the agreed scope directly from your client dashboard.
Every project gets an itemised quote based on scope, complexity and deadline. You pay only after you accept the quote.
Request a free quote online, message us on WhatsApp or email us. A specialist will reply with an itemised quote within 2-4 business hours.
You remain the author. For publications, the ICMJE recommends acknowledging writing assistance and editing rather than listing it as authorship. For coursework, follow your institution's academic integrity policy.
Describe your project and a specialist will reply with an itemized quote within 2-4 business hours.
Prefer email? info@timelyscholar.com