
To do a meta-analysis: (1) start from a systematic review with a clear question, (2) extract the numbers each study reports, (3) choose an effect measure such as an odds ratio or standardised mean difference, (4) pool the studies with inverse-variance weights using a fixed-effect or random-effects model, (5) quantify heterogeneity with I², τ² and a prediction interval, (6) run subgroup and sensitivity analyses, (7) check small-study effects with a funnel plot, and (8) present the results in a forest plot. R (metafor or meta), RevMan and Stata all do this.
Have studies ready to pool? Our statisticians can run or check your meta-analysis. Get a free quote →
What is a meta-analysis?
A meta-analysis is a statistical method that combines the results of two or more studies that address the same question into a single pooled estimate, with a confidence interval. Because it draws on more participants than any single study, the pooled result is usually more precise, and the analysis can also show whether and why results differ between studies.
A meta-analysis should be part of a systematic review. The systematic review finds and appraises all eligible studies; the meta-analysis combines their numbers. Pooling studies you happened to find, rather than all eligible ones, risks an answer that is precise but wrong. If you have not yet planned the review itself, start with our guide on how to do a systematic review.
Before you start: plan the analysis in your protocol
Decisions made after seeing the data are a major source of bias in meta-analysis. Write the analysis plan into your protocol (and your PROSPERO record) before extraction begins. At a minimum, state:
- the outcomes you will pool and the time points that count;
- the effect measure for each outcome and how you will convert data reported in other formats;
- the model (fixed or random effects) and estimator you will use;
- how you will assess heterogeneity, and which subgroup analyses you will run and why;
- your sensitivity analyses, including how you will treat studies at high risk of bias;
- how you will assess small-study effects and the certainty of the evidence (for example with GRADE; Guyatt et al., 2008).
Any later changes are allowed, but should be reported as deviations with reasons. Our PROSPERO registration template prompts for each of these items.
Step 1: Extract the right data from each study
What you extract depends on the type of outcome:
| Outcome type | What to extract per group | Example |
|---|---|---|
| Binary (event or no event) | Number of events and total participants | Deaths out of patients randomised |
| Continuous | Mean, standard deviation and sample size | Mean HbA1c and SD at 12 weeks |
| Time-to-event | Hazard ratio and its standard error or confidence interval | HR for progression-free survival |
| Pre-calculated effects | Effect size and its standard error or variance | A reported odds ratio with 95% CI |
Studies rarely report everything in the same way. You will often need to derive standard deviations from standard errors or confidence intervals, estimate means from medians and ranges, or convert between effect measures. Record every conversion so it can be checked.
Step 2: Choose an effect measure
- Odds ratio (OR) or risk ratio (RR) for binary outcomes. Both are analysed on the log scale. Risk ratios are often easier to interpret; odds ratios have useful mathematical properties.
- Risk difference (RD) gives an absolute effect, which is useful for calculating the number needed to treat.
- Mean difference (MD) for continuous outcomes measured on the same scale in every study.
- Standardised mean difference (SMD), such as Hedges' g, when studies measure the same concept on different scales (for example, different depression questionnaires).
- Hazard ratio (HR) for time-to-event outcomes.
Decide the effect measure in your protocol, before seeing the results. Our effect size calculator computes Cohen's d and Hedges' g from means and SDs, and the odds ratio and relative risk calculators handle 2×2 tables.
Step 3: Pool the studies: fixed effect or random effects?
Most meta-analyses use inverse-variance weighting: each study's weight depends on its precision, so larger, more precise studies count for more. The key choice is the model.
| Fixed-effect model | Random-effects model | |
|---|---|---|
| Assumption | All studies estimate one identical true effect | True effects vary between studies; the analysis estimates their average |
| Weights | Strongly favour large studies | More even, because between-study variance is added |
| Confidence interval | Narrower | Wider when heterogeneity is present |
| When used | Studies are very similar, or few studies with a focus on the average effect | Studies differ in ways that may change the true effect |
The Cochrane Handbook (Deeks et al., 2024) notes that it is generally considered implausible that intervention effects across studies are identical, which is why many reviewers use random effects. Deeks et al. (2024) also note that the simplest random-effects method is the DerSimonian and Laird (1986) method, and that other versions have better statistical properties, such as restricted maximum likelihood (REML) with Hartung-Knapp adjusted confidence intervals, which modern software offers.
Rare events
When events are rare, standard methods can be biased. Deeks et al. (2024) advise avoiding inverse-variance methods (including DerSimonian and Laird) for rare events, and reports that at event rates below 1% the Peto one-step odds ratio method performed best in simulation studies, provided groups are reasonably balanced and effects are not very large. Our Mantel-Haenszel and Peto calculator implements these methods.
Step 4: Assess heterogeneity (I², τ² and prediction intervals)
Heterogeneity is the variation in results between studies beyond what chance alone would produce. You should measure it, try to explain it, and report it, because an average effect can hide important differences.
- Cochran's Q test asks whether there is more variation than expected by chance. It has low power when there are few studies.
- I² (Higgins et al., 2003) is the percentage of variability in effect estimates due to heterogeneity rather than chance.
- τ² (tau-squared) estimates the variance of true effects between studies, on the scale of the effect measure.
- Prediction interval (Riley et al., 2011) shows the range within which the true effect in a new, similar study is likely to fall. It is often much wider than the confidence interval, and it is the most intuitive way to show how much effects vary.
The Cochrane Handbook (Deeks et al., 2024) gives a rough guide to I² for meta-analyses of randomised trials: 0% to 40% might not be important; 30% to 60% may represent moderate heterogeneity; 50% to 90% may represent substantial heterogeneity; 75% to 100% considerable heterogeneity. The ranges overlap on purpose: the importance of a given I² depends on the size and direction of the effects and on the strength of evidence for heterogeneity.
Step 5: Explore heterogeneity and test robustness
Subgroup analyses compare pooled effects between groups of studies, for example by dose, population or risk of bias. Meta-regression extends this to continuous study characteristics, such as mean age or year. Both are observational comparisons across studies, so they generate hypotheses rather than prove causes. Pre-specify them in the protocol, and remember that meta-regression is generally not recommended with fewer than ten studies.
Sensitivity analyses check whether your conclusions depend on particular decisions: excluding high risk of bias studies, switching between fixed and random effects, or removing one study at a time (leave-one-out). If the result changes materially, say so.
Step 6: Check for publication bias and small-study effects
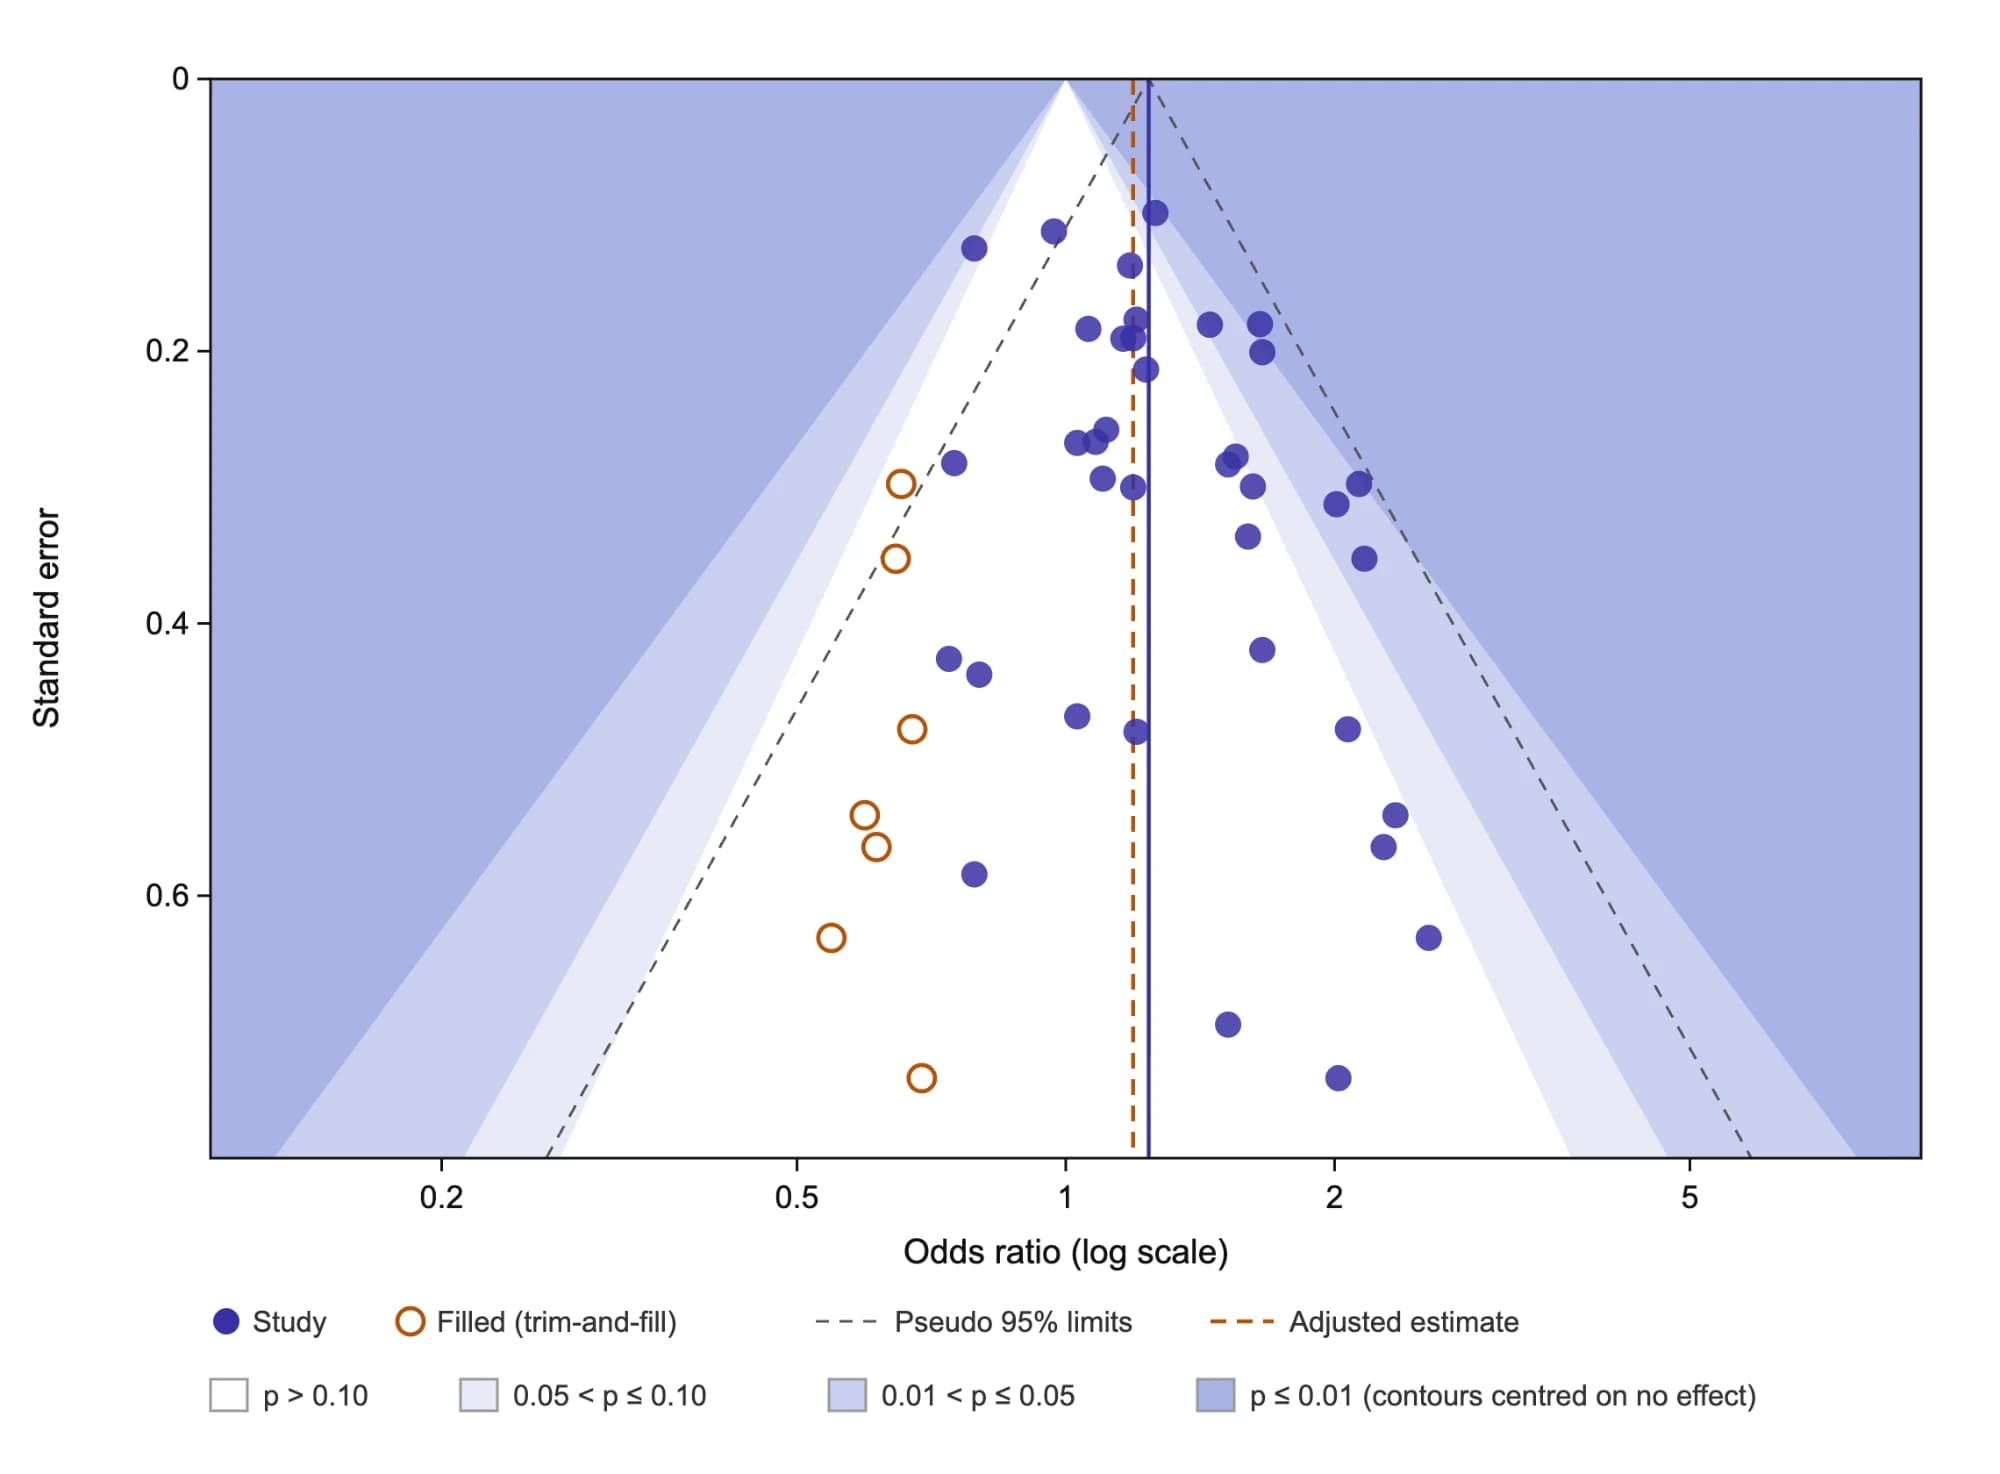
Studies with positive or significant results are more likely to be published, which can inflate a pooled estimate. A funnel plot shows each study's effect against its precision; in the absence of bias, the points form a symmetrical inverted funnel. Egger's regression test (Egger et al., 1997) tests for asymmetry.
The image at the top of this article is a contour-enhanced funnel plot: shaded regions show where results would be statistically significant, which helps you judge whether missing studies sit in areas of non-significance (suggesting publication bias) or elsewhere (suggesting other causes). Make your own with the free funnel plot generator, and try the DOI plot and LFK index or a selection model as alternatives.
Two cautions from the Cochrane Handbook (Page et al., 2024): tests for funnel plot asymmetry should be used only when there are at least 10 studies, because with fewer the tests have low power; and asymmetry has other causes besides publication bias, including genuine heterogeneity and poorer methods in smaller studies. Trim-and-fill (Duval & Tweedie, 2000) estimates how the result might change if missing studies were added, and is best treated as a sensitivity analysis.
Step 7: Present the results in a forest plot
The forest plot is the signature figure of a meta-analysis. Each study appears as a square (its estimate, sized by weight) with a horizontal line (its confidence interval); the diamond at the bottom shows the pooled estimate and its confidence interval; the vertical line marks no effect. Report the model, the pooled estimate with its 95% confidence interval, I², τ² and, for random effects, the prediction interval.
Read our full guide on how to read a forest plot, or make a publication-ready plot with the free forest plot generator.
"Across 12 randomised trials (n = 3,410), supervised exercise reduced HbA1c compared with usual care (random-effects mean difference −0.45 percentage points, 95% CI −0.62 to −0.28; I² = 48%; 95% prediction interval −0.90 to 0.00)."
Which software should you use? R, RevMan, Stata or SPSS
| Software | Strengths | Consider if |
|---|---|---|
| R (metafor, meta; Viechtbauer, 2010) | Free, extremely flexible, reproducible scripts, advanced models (multilevel, meta-regression, selection models) | You want full control and reproducible code |
| RevMan (Cochrane) | Designed for Cochrane reviews, guided workflow, standard forest plots and risk of bias tables | You are writing a Cochrane-style intervention review |
| Stata (meta suite) | Integrated meta-analysis commands, good graphics, widely used in epidemiology | Your team already uses Stata |
| SPSS (recent versions) | Point-and-click meta-analysis procedures | You need a basic analysis in a familiar interface |
Whatever you use, save the analysis script or file and the extracted dataset, and share them as supplementary material; PRISMA 2020 (Page et al., 2021) asks authors to report data and code availability.
Common meta-analysis mistakes
- Pooling apples and oranges: combining studies whose populations or interventions are too different.
- Double counting: including several comparisons or outcomes from the same study as if they were independent. Use a multilevel meta-analysis or choose one effect per study.
- Mixing change scores and final values inappropriately when using standardised mean differences.
- Interpreting I² as the amount of heterogeneity in absolute terms; it is a proportion, and depends on study precision.
- Running funnel plot tests with fewer than 10 studies.
- Reporting only the pooled estimate without the prediction interval, risk of bias and GRADE certainty.
Getting help with your meta-analysis
Meta-analysis rewards careful data preparation and a clear analysis plan. If you would like a statistician to check your extraction, run the models or review your forest plots, our meta-analysis service works in R, RevMan and Stata and explains every step so you can defend it to reviewers and examiners.
Frequently asked questions
What are the steps of a meta-analysis?
Extract data from each study, choose an effect measure, pool the studies with a fixed-effect or random-effects model, assess heterogeneity with I², τ² and prediction intervals, run subgroup and sensitivity analyses, check small-study effects, and present the results in a forest plot.
Should I use a fixed-effect or random-effects model?
Use random effects when studies differ in ways that could change the true effect, which is common. Fixed-effect models assume one identical true effect and are more defensible when studies are very similar.
How many studies do I need for a meta-analysis?
You can pool two studies, but estimates of heterogeneity are unreliable with few studies. Funnel plot asymmetry tests should be used only with at least 10 studies, and meta-regression is generally not recommended with fewer than ten.
What is a good I² value?
There is no universal cut-off. The Cochrane Handbook's rough guide (Deeks et al., 2024) is that 0% to 40% might not be important and 75% to 100% is considerable, but interpretation depends on the size and direction of effects and the evidence for heterogeneity.
Can I do a meta-analysis in SPSS?
Recent versions of SPSS include meta-analysis procedures for basic analyses. R (metafor or meta), RevMan and Stata offer more flexibility and are more widely used in published reviews.
What is the difference between a meta-analysis and a systematic review?
A systematic review is the full process of finding and appraising studies; a meta-analysis is the statistical pooling of their results, done within the review when appropriate.
Sources
- Deeks JJ, Higgins JPT, Altman DG, McKenzie JE, Veroniki AA, editors. Chapter 10: Analysing data and undertaking meta-analyses. In: Higgins JPT, Thomas J, Chandler J, et al., editors. Cochrane Handbook for Systematic Reviews of Interventions version 6.5. Cochrane; 2024
- Page MJ, Higgins JPT, Sterne JAC. Chapter 13: Assessing risk of bias due to missing evidence in a meta-analysis. In: Higgins JPT, Thomas J, Chandler J, et al., editors. Cochrane Handbook for Systematic Reviews of Interventions version 6.5. Cochrane; 2024
- Higgins JPT, Thompson SG, Deeks JJ, Altman DG. Measuring inconsistency in meta-analyses. BMJ 2003;327:557-560
- Riley RD, Higgins JPT, Deeks JJ. Interpretation of random effects meta-analyses. BMJ 2011;342:d549
- DerSimonian R, Laird N. Meta-analysis in clinical trials. Control Clin Trials 1986;7:177-188
- Egger M, Davey Smith G, Schneider M, Minder C. Bias in meta-analysis detected by a simple, graphical test. BMJ 1997;315:629-634
- Duval S, Tweedie R. Trim and fill: a simple funnel-plot-based method of testing and adjusting for publication bias in meta-analysis. Biometrics 2000;56:455-463
- Viechtbauer W. Conducting meta-analyses in R with the metafor package. J Stat Softw 2010;36(3):1-48
- Page MJ, McKenzie JE, Bossuyt PM, et al. The PRISMA 2020 statement: an updated guideline for reporting systematic reviews. BMJ 2021;372:n71
- Guyatt GH, Oxman AD, Vist GE, et al. GRADE: an emerging consensus on rating quality of evidence and strength of recommendations. BMJ 2008;336:924-926

Maria has 9 years of experience in public health, clinical research, evidence synthesis, and review methodology. She helps research teams build coherent review methods and document them so that others can follow and reproduce them. Areas of expertise Scoping review design and protocol development Structured search…