
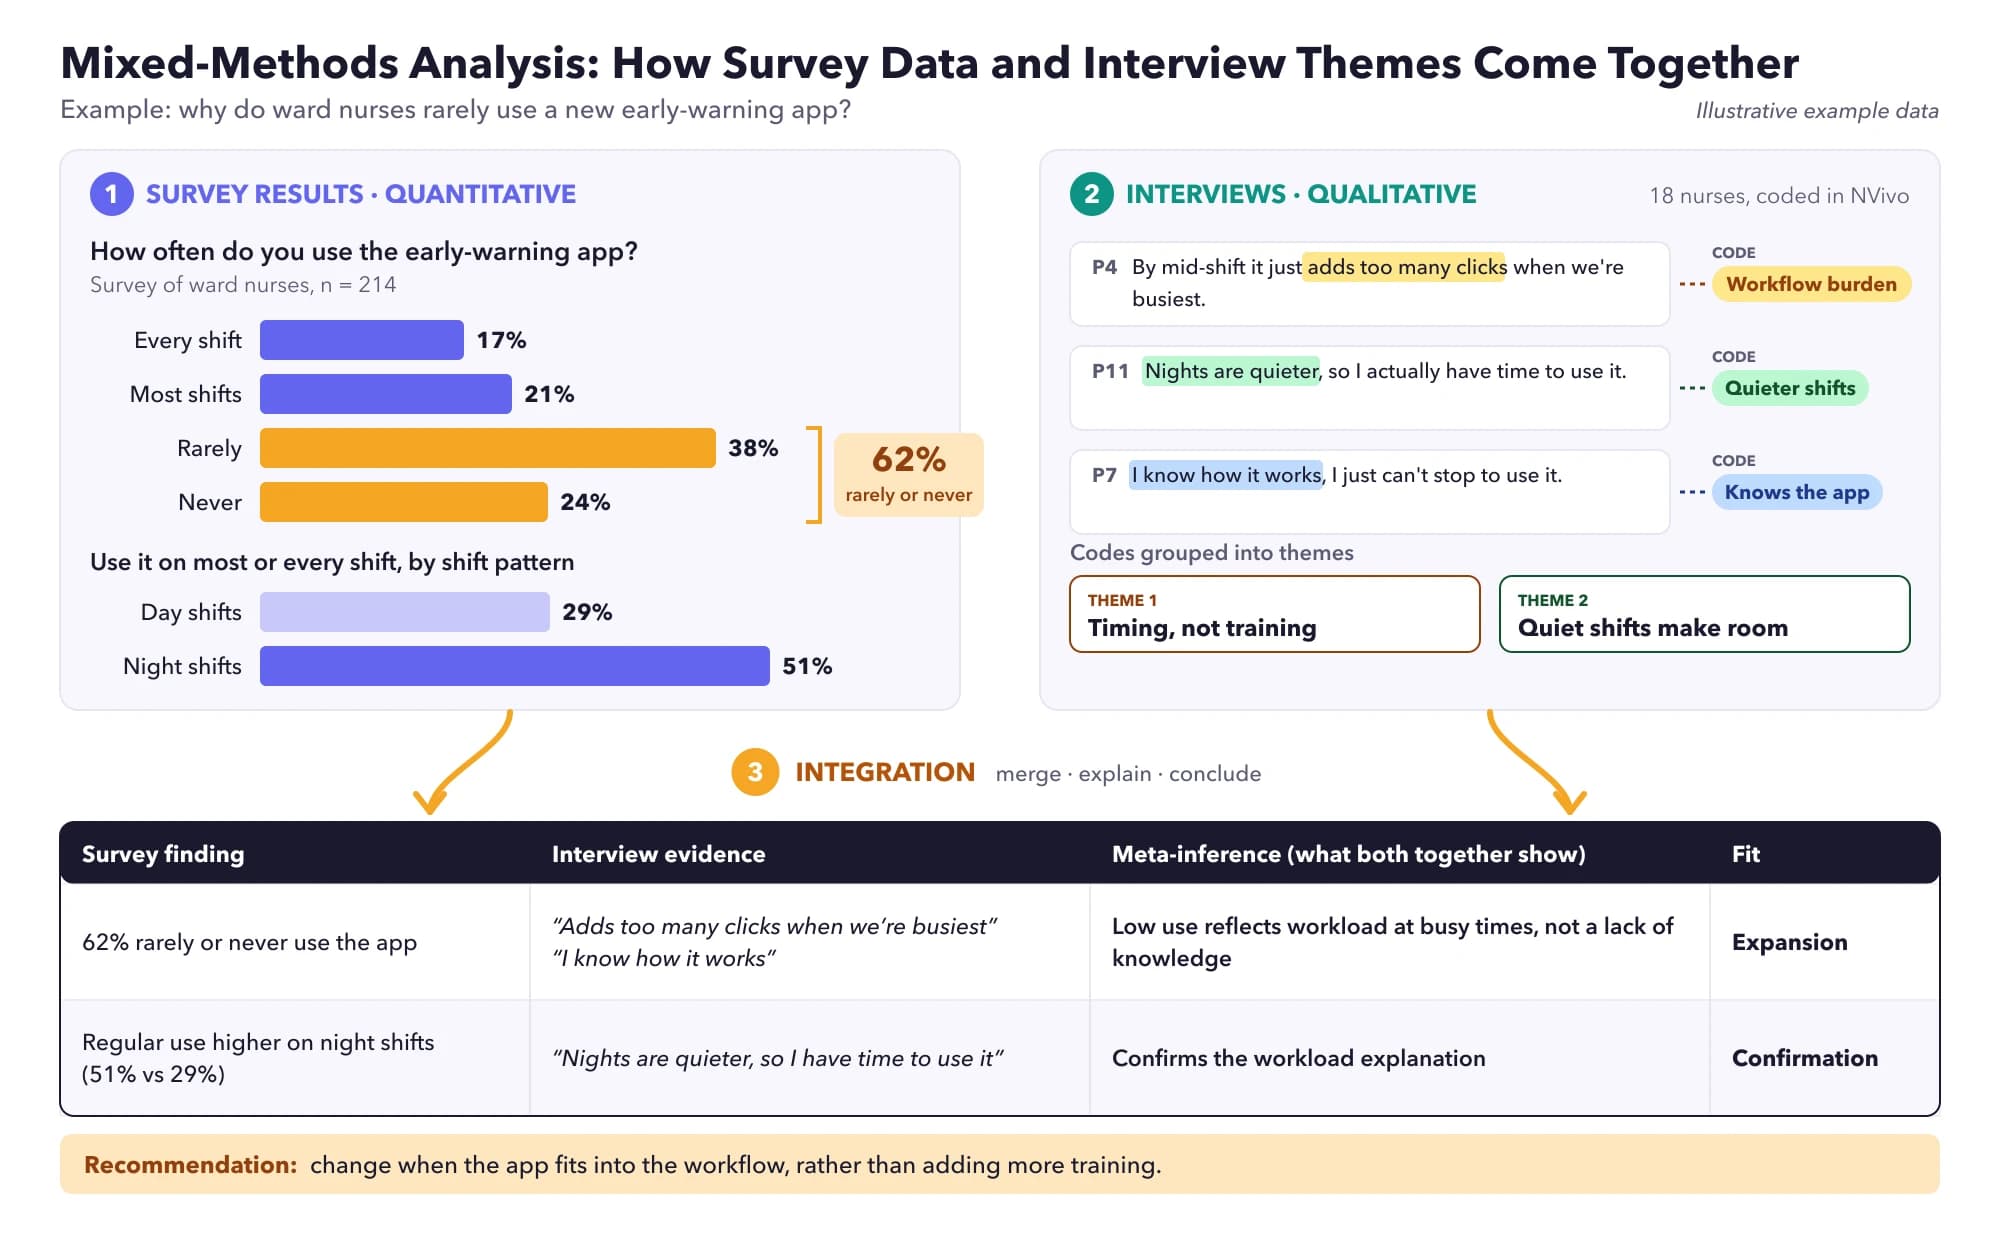
Mixed methods research combines quantitative data (numbers, such as surveys or trial outcomes) and qualitative data (words, such as interviews) in one study and deliberately integrates them to answer a question neither could answer alone. The three core designs are: convergent (collect both at the same time and compare), explanatory sequential (quantitative first, then qualitative to explain the results) and exploratory sequential (qualitative first, then quantitative to test or measure what was found). Integration, through connecting, building, merging or embedding the data, and through joint displays, is what makes a study truly mixed methods.
Combining numbers and interviews? Our specialists can help you analyse and integrate them. Get a free quote →
What is mixed methods research?
Mixed methods research is an approach in which a researcher or team collects, analyses and integrates both quantitative and qualitative data within a single study or a programme of studies. Its core idea is that numbers and narratives answer different parts of a complex question: quantitative data show how much, how often and whether things are related; qualitative data show how, why and what it means to the people involved.
It is popular in health services research, nursing, education, psychology, public health, evaluation and business, especially for complex interventions, programme evaluations, and questions about implementation. It is also increasingly common in dissertations and DNP projects, where students combine outcome data with staff or patient interviews.
Simply having a survey and some interviews in the same project does not make a study mixed methods. The defining feature is integration: the two strands are deliberately connected in the design, the methods or the interpretation.
When should you use a mixed methods design?
- Explanation: your survey or trial shows a surprising result, and you need to understand why.
- Exploration before measurement: little is known, so you need interviews to identify concepts before designing a questionnaire or intervention.
- Corroboration (triangulation): you want to see whether different kinds of evidence point to the same conclusion.
- Completeness: the question has parts that only numbers or only words can answer, such as whether a programme works and how staff experience delivering it.
- Intervention development and evaluation: qualitative work shapes an intervention, a trial tests it, and process evaluation explains the results.
Mixed methods is not always the best choice. It demands skills in both traditions, more time and more resources. If a single method answers your question well, use it.
The three core mixed methods designs
Fetters et al. (2013) describe three basic designs, which remain the standard vocabulary in textbooks and journals:
| Design | Sequence | Purpose | Example |
|---|---|---|---|
| Convergent (parallel) | QUAN and QUAL at the same time, analysed separately, then merged | Compare or corroborate results; get a fuller picture | Patient satisfaction survey and patient interviews run together in the same clinics |
| Explanatory sequential | QUAN → QUAL | Use qualitative data to explain quantitative results | A survey finds low uptake of a service; interviews with non-users explore why |
| Exploratory sequential | QUAL → QUAN | Use qualitative findings to build a measure, intervention or hypothesis, then test it | Focus groups identify barriers to exercise; the barriers become items in a new questionnaire tested in a large sample |
Convergent design
Both strands are collected in roughly the same period and analysed independently, then brought together to see where they agree (confirmation), where one adds to the other (expansion), and where they conflict (discordance). Discordant findings are not failures; explaining them is often the most insightful part of the study.
Explanatory sequential design
The quantitative phase comes first, and its results determine what happens in the qualitative phase: which participants to interview (for example, high and low scorers, or outliers) and what to ask. This design is popular with researchers who are more familiar with quantitative methods, because the study begins with a conventional analysis.
Exploratory sequential design
The qualitative phase comes first, often because the concepts, language or context are not well understood. Its findings are then built into a quantitative instrument or intervention that is tested in the second phase. When the output is a new questionnaire, plan psychometric testing, for example internal consistency with our Cronbach's alpha calculator.
Advanced (complex) designs
Fetters et al. (2013) also describe four advanced frameworks that build the core designs into larger studies:
- Multistage: several phases of core designs over a long programme, such as a multi-year evaluation.
- Intervention: qualitative data are added before, during or after a trial, for example to develop the intervention, assess implementation (process evaluation) or explain outcomes.
- Case study: qualitative and quantitative data are combined to build an in-depth understanding of one or more cases, such as hospitals or schools.
- Participatory: community members or stakeholders are involved throughout, often with an action or social justice aim.
Mixed methods notation
Researchers often summarise designs with a simple notation system:
| Notation | Meaning |
|---|---|
| QUAN / QUAL (capitals) | The strand is given priority |
| quan / qual (lower case) | The strand has a supporting role |
| → | Sequential: the second strand follows the first |
| + | Concurrent: the strands happen at the same time |
| ( ) | Embedded: one strand sits within another, e.g. QUAN(qual) |
QUAN → qual: an explanatory sequential design where the survey is the main strand
QUAL + QUAN: a convergent design with equal priority
QUAN(qual): a trial with an embedded qualitative process evaluation
Integration: the heart of mixed methods
Fetters et al. (2013) describe integration at three levels. Planning all three is the best way to avoid a study that reads like two separate reports stapled together.
1. Design level
Choosing a convergent, explanatory or exploratory design (or an advanced framework) sets out how the strands relate from the start.
2. Methods level
- Connecting: one dataset links to the other through sampling, for example choosing interviewees based on survey scores.
- Building: one dataset informs the data collection of the other, for example turning interview themes into survey items.
- Merging: the two datasets are brought together for analysis and comparison.
- Embedding: data collection and analysis are linked at multiple points, as in a trial with an ongoing process evaluation.
3. Interpretation and reporting level
- Narrative: integrating results in the text, by weaving qualitative and quantitative findings together theme by theme, presenting them in separate sections of one report, or reporting them in separate publications.
- Data transformation: converting one type of data into the other, such as counting how often a theme appears or turning scores into categories.
- Joint displays: tables or figures that put both types of data side by side, making integration visible.
| Survey finding | Interview theme | Meta-inference |
|---|---|---|
| 62% of nurses rarely use the new early warning app | "It adds clicks when we're busiest" | Low use reflects workflow burden, not lack of knowledge; redesign should target timing, not training (expansion) |
| Use is highest on the night shift | "Nights are quieter, so I have time to learn it" | Supports the workload explanation (confirmation) |
| Staff rate the app as easy to use | Senior nurses describe it as confusing | Experience may shape usability; test by role in the next phase (discordance) |
The final column, the meta-inference, is the conclusion you can only draw by combining both strands. Describe the fit of integration explicitly: do the strands confirm, expand on or contradict each other?
Sampling and analysis in each strand
Each strand must meet the standards of its own tradition. The quantitative strand needs an adequate, well-defined sample and appropriate statistics; plan the sample size with a power analysis and choose tests with our statistical test selector. The qualitative strand needs purposeful sampling and a clearly described method, such as thematic analysis (Braun & Clarke, 2006).
In sequential designs the samples are usually related (the qualitative participants are a subset of the survey respondents). In convergent designs the samples may be the same people, overlapping, or different, but they should come from the same population if you want to compare results.
Worked example: planning an explanatory sequential study
Suppose a hospital introduced a digital early warning app for deteriorating patients, and managers want to know how well it is being used and why. An explanatory sequential design (QUAN → qual) might look like this:
- Research questions. Quantitative: What proportion of nurses use the app, and does use differ by shift, unit and experience? Qualitative: How do nurses explain their patterns of use? Mixed: How do nurses' experiences explain the variation in use?
- Phase 1 (QUAN). An online survey of all ward nurses measures frequency of use, perceived usefulness and ease of use with validated scales, plus demographics. Analysis uses descriptive statistics and regression to identify predictors of use.
- Connecting. Survey results guide sampling: nurses with high and low use, from different units and shifts, are invited to interview.
- Phase 2 (qual). Semi-structured interviews explore the survey's key findings, with the interview guide built around the strongest and most surprising predictors. Analysis uses reflexive thematic analysis.
- Integration. A joint display links each quantitative finding to the qualitative themes that explain it, with meta-inferences and a judgement of fit.
- Output. Recommendations target the specific barriers identified, for example workflow timing or role-specific training.
Notice that the second phase cannot be fully planned until the first is analysed. Build this into your timeline and ethics application, for example by submitting the interview guide as a draft to be refined.
Writing up and reporting a mixed methods study
O'Cathain et al. (2008) proposed the Good Reporting of A Mixed Methods Study (GRAMMS) guideline, which asks authors to describe:
- the justification for using a mixed methods approach;
- the design, in terms of purpose, priority and sequence of methods;
- each method, in terms of sampling, data collection and analysis;
- where integration occurred, how it occurred and who participated in it;
- any limitation of one method associated with the presence of the other;
- any insights gained from mixing or integrating methods.
Structure your methods section by design, then by strand, then by integration. In results, you can report each strand first and then an integrated section, or integrate throughout by theme. Include at least one joint display.
Appraising mixed methods studies
If you are reviewing mixed methods research, for example in a systematic or integrative review, the Mixed Methods Appraisal Tool (MMAT), version 2018 (Hong et al., 2018) lets you appraise qualitative, randomised, non-randomised, quantitative descriptive and mixed methods studies with one tool. It begins with two screening questions and then has five criteria per study category.
Common mixed methods mistakes
- No stated rationale for mixing methods.
- No integration: two separate studies reported side by side.
- A token qualitative strand (for example three open survey questions) presented as a full qualitative component.
- Qualitative sample chosen without reference to the quantitative results in an explanatory design.
- Ignoring or hiding discordant findings instead of explaining them.
- Underestimating the time needed for two full data collection and analysis phases.
Getting help with mixed methods research
Few researchers are equally confident in statistics and qualitative analysis. Our mixed methods research and analysis service brings both skill sets: we can help design the study, run the statistics, support thematic analysis and build joint displays that show integration clearly. If you are at the planning stage, see our guide on how to write a research proposal.
Frequently asked questions
What are the three main mixed methods designs?
Convergent (quantitative and qualitative data collected at the same time and merged), explanatory sequential (quantitative first, then qualitative to explain), and exploratory sequential (qualitative first, then quantitative to test or measure).
What is integration in mixed methods research?
Integration is the deliberate combining of quantitative and qualitative strands, at the design level, the methods level (connecting, building, merging or embedding) and the interpretation level (narrative, data transformation and joint displays).
What is a joint display?
A joint display is a table or figure that presents quantitative and qualitative findings side by side, often with a column for the combined interpretation (meta-inference).
Is a survey with open-ended questions mixed methods?
Not necessarily. Unless the open-ended responses are analysed with a qualitative method and deliberately integrated with the quantitative results, it is better described as a survey with some qualitative data.
How do I report a mixed methods study?
The GRAMMS guideline (O'Cathain et al., 2008) asks you to justify the approach, describe the design, describe each method, explain where and how integration occurred, note limitations, and describe insights gained from mixing methods.
What is the difference between mixed methods and multimethod research?
Multimethod research uses more than one method, which may be all quantitative or all qualitative. Mixed methods specifically combines quantitative and qualitative approaches and integrates them.
Sources
- Fetters MD, Curry LA, Creswell JW. Achieving integration in mixed methods designs: principles and practices. Health Serv Res 2013;48:2134-2156
- O'Cathain A, Murphy E, Nicholl J. The quality of mixed methods studies in health services research. J Health Serv Res Policy 2008;13(2):92-98
- Hong QN, Fàbregues S, Bartlett G, et al. The Mixed Methods Appraisal Tool (MMAT) version 2018 for information professionals and researchers. Educ Inf 2018;34(4):285-291
- Braun V, Clarke V. Using thematic analysis in psychology. Qual Res Psychol 2006;3:77-101