
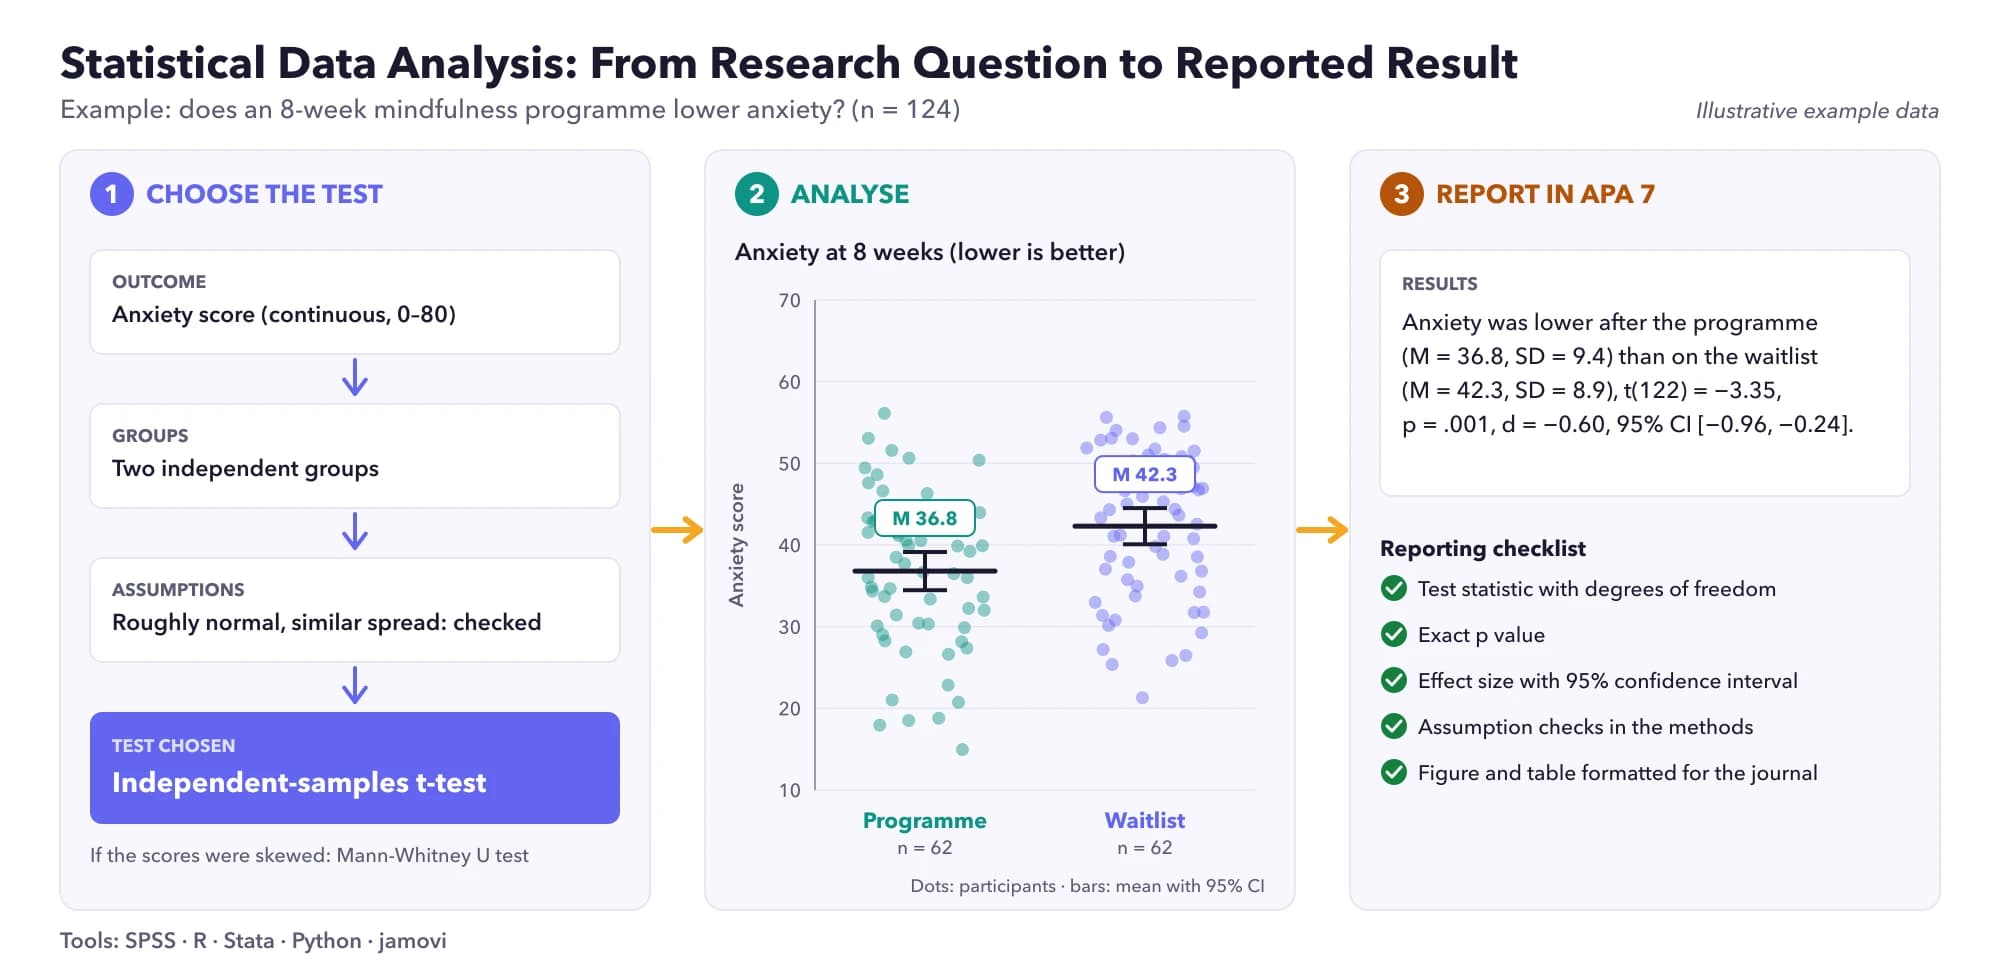
In APA 7, report the test statistic with its degrees of freedom, the exact p value, and an effect size with a confidence interval, for example: t(58) = 2.45, p = .017, d = 0.63, 95% CI [0.11, 1.15]. Key rules: italicise statistical symbols (M, SD, t, F, p, r, N); put spaces around = and <; give exact p values to two or three decimals and write p < .001 for smaller values; omit the leading zero for statistics that cannot exceed 1 (p = .042, r = .31) but keep it for those that can (d = 0.45); report confidence intervals in square brackets; and round to two decimal places in most cases.
Unsure about your analysis? Our statisticians can plan, run and explain it with you. Get a free quote →
Why APA statistics formatting matters
The Publication Manual of the American Psychological Association, 7th edition (APA 7; American Psychological Association, 2020), sets the standard for reporting statistics in psychology, nursing, education, social sciences, business and many health journals. Markers and reviewers notice formatting errors immediately: a missing italic, a leading zero on a p value, or a result reported without degrees of freedom suggests carelessness, even when the analysis is sound.
The purpose of the rules is practical. Consistent formatting lets readers find and check your results quickly, and complete reporting lets them confirm your analysis or include it in a future meta-analysis. This guide covers the rules you need most often, with copy-ready templates for every common test.
The general rules for statistics in APA 7
Italics
Italicise statistical symbols that are Latin letters: M, SD, SE, N, n, t, F, p, r, R², b, z, U, d. Use standard (non-italic) type for Greek letters such as χ², α, β and η², for subscripts that are labels rather than variables, and for abbreviations such as CI, df and log. Use bold for vectors and matrices.
Spacing
Put a space on each side of mathematical operators: p = .032, not p=.032. A minus sign showing a negative number has no space between the sign and the number: b = −0.42.
Leading zeros
Use a zero before the decimal point when a statistic can be greater than 1 (d = 0.45, M = 0.87 kg). Omit it when the statistic cannot exceed 1, such as p values, correlations and proportions (p = .042, r = .31).
Decimal places
APA's principle is to round as much as possible while keeping appropriate precision. In practice, two decimal places suits most correlations, proportions and inferential statistics. The Purdue Online Writing Lab's (n.d.) summary of APA 7 suggests one decimal place for means and standard deviations; many authors use two, especially for scales with small ranges. Choose based on the precision of your measure and be consistent.
p values
Report exact p values to two or three decimal places (p = .03 or p = .027). For values below .001, write p < .001. Do not write p = .000, which is impossible.
Sample size symbols
Use uppercase italic N for the total sample and lowercase italic n for a subgroup, such as a treatment arm.
Confidence intervals
Report confidence intervals in square brackets with the confidence level: 95% CI [0.12, 0.58]. You do not need to repeat the unit of measurement inside the brackets.
Reporting descriptive statistics
Always report means and standard deviations (or medians and interquartile ranges for skewed data) for your key variables, overall and by group. Our guide to descriptive statistics in SPSS shows how to get them and which to use for each type of variable.
Participants (N = 124) were aged 19 to 64 years (M = 34.6, SD = 11.2).
Anxiety scores were higher in the control group (M = 42.3, SD = 8.9) than in the intervention group (M = 36.8, SD = 9.4).
Length of stay was skewed (Mdn = 4 days, IQR = 3–7).
APA suggests a simple rule of thumb: with three or fewer numbers, use a sentence; with about 4 to 20 numbers, use a table; with more than 20, consider a figure. A participant characteristics table is often the clearest way to show descriptive data.
How to report a t-test in APA 7
Report the group means and SDs, t with degrees of freedom in parentheses, the exact p value, and an effect size such as Cohen's d with its confidence interval. For a full worked example from SPSS output, see our independent-samples t-test guide.
Independent samples: Students taught with simulation scored higher (M = 78.4, SD = 9.1) than those taught with lectures (M = 72.6, SD = 9.3), t(58) = 2.45, p = .017, d = 0.63, 95% CI [0.11, 1.15].
Welch's test: t(49.3) = 2.41, p = .020. Degrees of freedom are often non-integers for Welch's test; report them to one or two decimals.
Paired samples: Systolic blood pressure fell from before (M = 142.5, SD = 12.8) to after the programme (M = 136.1, SD = 11.9), t(39) = 3.87, p < .001, d = 0.61.
How to report ANOVA in APA 7
Report F with two degrees of freedom (between groups, within groups), the p value, and an effect size such as η² or partial η². Follow a significant result with post hoc comparisons.
A one-way ANOVA showed that pain scores differed across the three analgesics, F(2, 87) = 6.12, p = .003, η² = .12. Tukey post hoc tests showed lower pain with Drug A (M = 3.2, SD = 1.4) than Drug C (M = 4.6, SD = 1.6), p = .002; other comparisons were not significant.
Two-way ANOVA: There was a significant interaction between training and experience, F(1, 116) = 5.47, p = .021, partial η² = .05.
Note that η² cannot exceed 1, so no leading zero is used. Worked examples: one-way ANOVA in SPSS and main effects and interactions in a 2 × 2 ANOVA.
How to report a chi-square test in APA 7
Report χ² with degrees of freedom and the sample size in parentheses, the p value, and an effect size such as φ (for 2×2 tables) or Cramér's V. Include the percentages so readers can see the direction of the association.
Post-operative infection was more common among smokers (18 of 100, 18%) than non-smokers (10 of 140, 7%), χ²(1, N = 240) = 6.67, p = .010, φ = .17.
Fisher's exact test (small expected counts): Infection rates did not differ between dressings (3 of 25 vs 1 of 24), p = .61, Fisher's exact test.
How to report a correlation in APA 7
Report r (or Spearman's rₛ) with degrees of freedom (N − 2) in parentheses, the p value and ideally the confidence interval.
Hours of sleep were negatively correlated with reaction time, r(48) = −.42, p = .002, 95% CI [−.62, −.16].
Spearman: Satisfaction was positively related to continuity of care, rₛ(98) = .29, p = .003.
How to report regression in APA 7
Linear regression
Report the overall model (R², F, df, p), then each predictor's coefficient (b or β), standard error or confidence interval, t and p. With several predictors, use a table.
Study hours significantly predicted exam score, b = 2.14, 95% CI [1.12, 3.16], t(98) = 4.17, p < .001. The model explained 15% of the variance, R² = .15, F(1, 98) = 17.39, p < .001.
Logistic regression
Report odds ratios with 95% confidence intervals for each predictor, and a measure of model fit.
After adjusting for age and comorbidity, living alone was associated with higher odds of 30-day readmission, OR = 1.84, 95% CI [1.21, 2.80], p = .004.
How to report non-parametric tests
Mann-Whitney U: Satisfaction was higher on Ward A (Mdn = 4) than Ward B (Mdn = 3), U = 812.5, z = −2.61, p = .009, r = .26.
Wilcoxon signed-rank: Pain decreased after the intervention (Mdn = 6 before, 4 after), z = −3.42, p < .001, r = .48.
Kruskal-Wallis: Waiting times differed across clinics, H(2) = 9.87, p = .007.
Report medians rather than means for non-parametric tests. The effect size r is often calculated as z divided by the square root of N.
Reporting effect sizes and power analyses
APA 7 encourages authors to report effect sizes and confidence intervals (American Psychological Association, 2020), not just significance tests, because they show how large and how precise an effect is. Name the effect size you used (Cohen's d, Hedges' g, η², r, odds ratio) and, if it is unusual, how it was calculated.
In the method section, report how you determined sample size. A typical sentence: "An a priori power analysis indicated that 64 participants per group would provide 80% power to detect a medium effect (d = 0.50) at α = .05, two-tailed." Cohen's (1992) benchmarks for small, medium and large effects are a common reference point, though a field-specific estimate is better when available. Calculate yours with the power analysis calculator.
Putting it together: a complete APA results paragraph
A good results paragraph states what was tested, the direction of the finding in words, and then the statistics that support it. It does not interpret or discuss; that belongs in the discussion section.
Of the 124 participants, 62 were randomised to the mindfulness programme and 62 to the waitlist control. Groups were similar at baseline (Table 1).
At 8 weeks, anxiety scores were lower in the mindfulness group (M = 36.8, SD = 9.4) than in the control group (M = 42.3, SD = 8.9), t(122) = −3.35, p = .001, d = −0.60, 95% CI [−0.96, −0.24].
The proportion of participants with clinically significant anxiety fell from 45% to 26% in the mindfulness group and from 47% to 42% in the control group (Figure 1).
Notice the pattern: plain-language finding first, then descriptive statistics, then the inferential test and effect size. Readers who skip the numbers still understand the result, and readers who want the numbers can check them.
The most common APA statistics errors
- Writing p = .000 (use p < .001).
- Writing p = 0.03 with a leading zero, or "p = .03" without italics.
- Omitting degrees of freedom: t = 2.45 instead of t(58) = 2.45.
- Reporting only "significant" or "p < .05" instead of the exact value.
- Mixing decimal places, such as M = 3.4 and SD = 1.237.
- Reporting significance without an effect size.
- Using round brackets for confidence intervals instead of square brackets.
Statistics in APA tables and figures
- Number tables and figures in bold (Table 1), with the title in italic title case on the next line.
- Use horizontal lines only (no vertical lines) in tables.
- Define abbreviations and symbols in a note below the table.
- Mark significance with asterisks and explain them in the note, or better, report exact p values in a column.
- Do not repeat every number from a table in the text; highlight the key findings and refer to the table.
For figures, see our guide on how to make figures for a scientific paper.
APA statistics checklist before you submit
- Every statistical symbol italicised (except Greek letters).
- Spaces around =, < and >.
- No leading zero for p, r, proportions and η²; leading zero for d, b and means below 1.
- Exact p values, with p < .001 for very small values and no p = .000.
- Degrees of freedom reported for t, F, χ² and r.
- Effect sizes and confidence intervals reported alongside significance tests.
- Consistent decimal places throughout.
- Abbreviations such as ANOVA defined at first use.
- Numbers in text and tables match.
Getting help with results reporting
If you want an expert to check your results chapter for accuracy and APA formatting, or to run and write up the analysis with you, our statistical data analysis service can help. Not sure which test you need? Read which statistical test should I use? first.
Frequently asked questions
How do you report a p value in APA 7?
Report the exact p value to two or three decimal places, italicised and without a leading zero, for example p = .027. For values smaller than .001, write p < .001.
Do you put a zero before the decimal in APA?
Use a leading zero when the statistic can exceed 1, such as d = 0.45. Omit it when the statistic cannot exceed 1, such as p values, correlations and proportions.
How do you report a t-test in APA format?
Give the group means and SDs, then t with degrees of freedom, the exact p value and an effect size, for example t(58) = 2.45, p = .017, d = 0.63.
How do you report a confidence interval in APA 7?
Use square brackets after the confidence level, for example 95% CI [0.12, 0.58].
Which statistical symbols are italicised in APA?
Latin-letter symbols such as M, SD, N, n, t, F, p, r and d are italicised. Greek letters such as χ² and η² and abbreviations such as CI are not.
How many decimal places should I use in APA 7?
APA advises rounding as much as possible while keeping appropriate precision (American Psychological Association, 2020). Two decimal places suits most inferential statistics, correlations and proportions; be consistent throughout.
Sources
- American Psychological Association. Publication Manual of the American Psychological Association. 7th ed. Washington, DC: American Psychological Association; 2020
- Purdue Online Writing Lab. APA numbers and statistics (7th edition). Purdue University; n.d.
- Purdue Online Writing Lab. Statistics in APA. Purdue University; n.d.
- Cohen J. A power primer. Psychol Bull 1992;112:155-159