
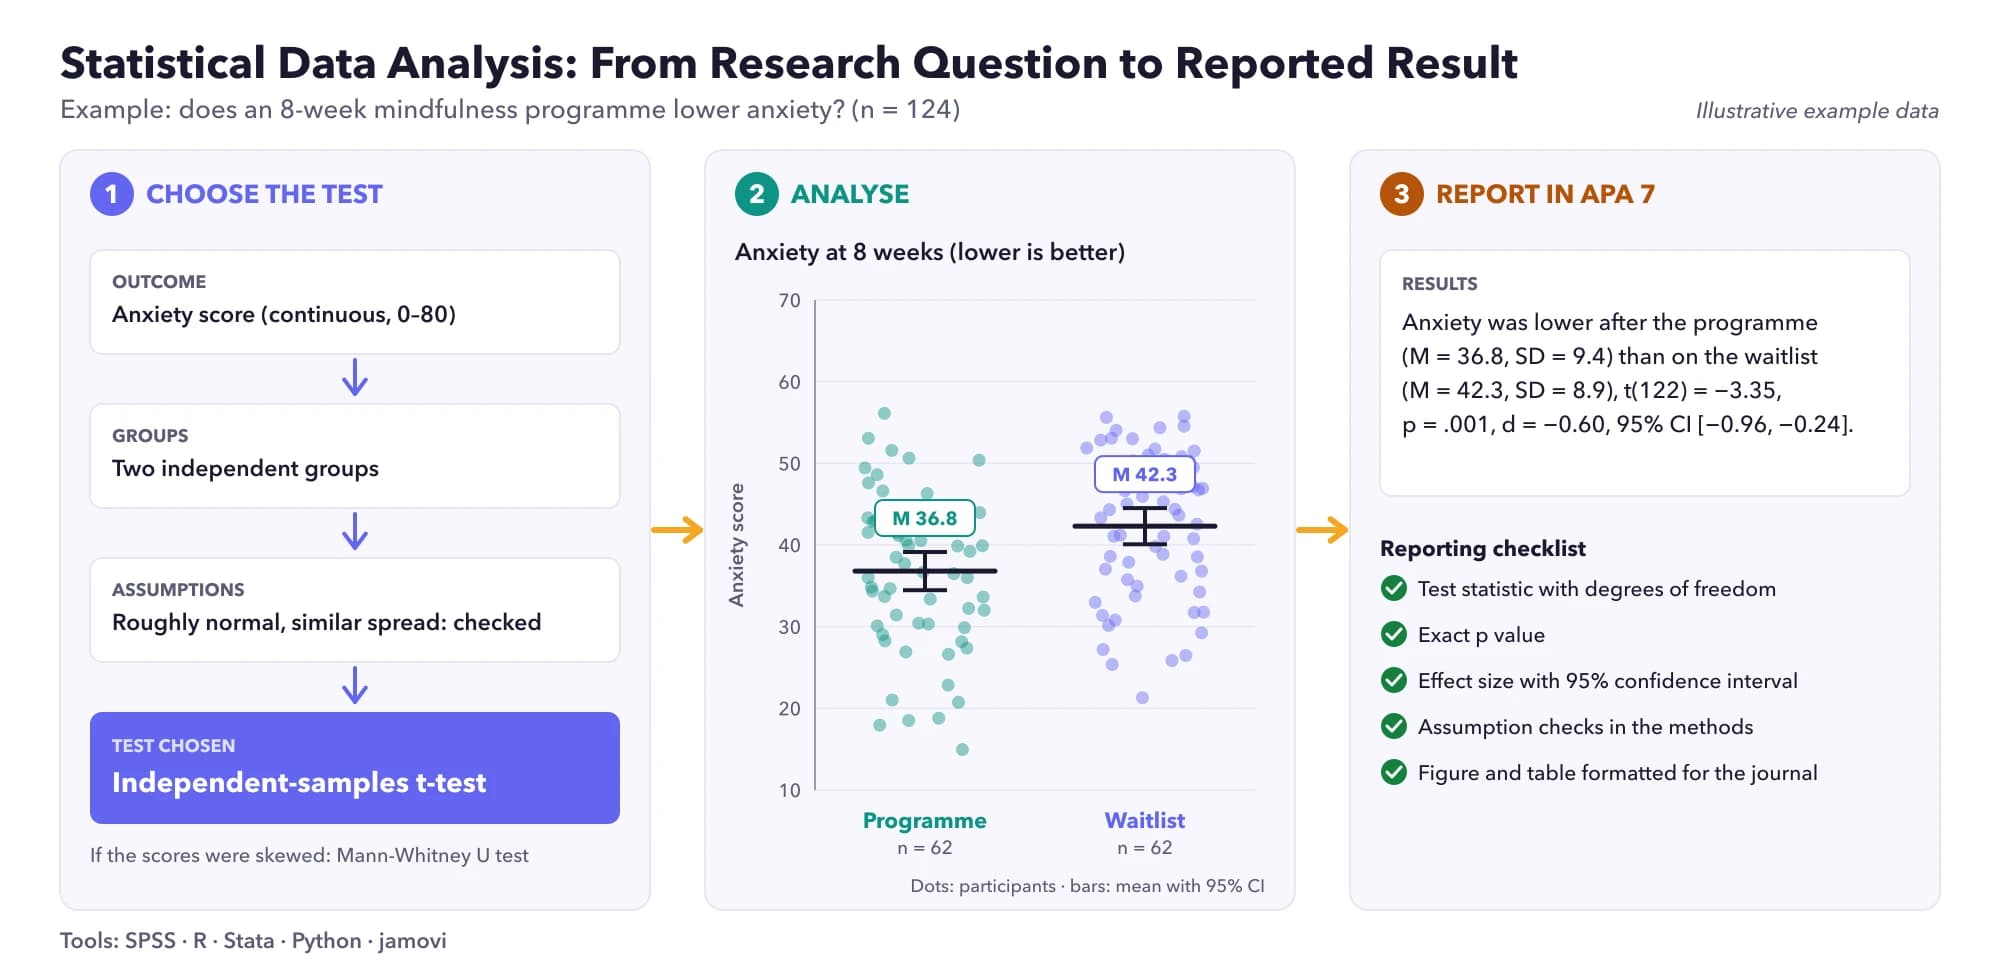
To choose a statistical test, answer three questions: (1) What is your aim? Comparing groups, or looking at a relationship or prediction? (2) What type is your outcome variable? Continuous, ordinal, or categorical? (3) How many groups, and are they independent or paired? Then match: two independent groups with a continuous outcome use an independent t-test (or Mann-Whitney U if assumptions fail); paired data use a paired t-test (or Wilcoxon signed-rank); three or more groups use one-way ANOVA (or Kruskal-Wallis); two categorical variables use a chi-square test (or Fisher's exact test for small samples); relationships use Pearson or Spearman correlation; prediction uses linear or logistic regression.
Unsure about your analysis? Our statisticians can plan, run and explain it with you. Get a free quote →
The three questions that decide your statistical test
Choosing a statistical test feels complicated because there are so many of them, but for most student projects, dissertations and journal articles, the choice comes down to three questions. Answer them in order and the right test usually becomes obvious.
- What is your research question trying to do? Compare groups ("Is there a difference?") or examine a relationship ("Is X associated with Y?", "Does X predict Y?").
- What type of data is your outcome (dependent) variable? Continuous, ordinal or categorical.
- How many groups are you comparing, and are the observations independent or paired? Different people in each group, or the same people measured twice?
Step 1: Identify your variable types
| Type | Definition | Examples |
|---|---|---|
| Continuous (interval / ratio) | Numeric measurements on a scale with meaningful distances | Blood pressure, age, weight, exam score, reaction time |
| Ordinal | Ordered categories with unequal or unknown gaps | Pain rated mild/moderate/severe, Likert items, cancer stage |
| Nominal (categorical) | Categories with no natural order | Sex, blood group, treatment group, yes/no outcomes |
| Binary (dichotomous) | A nominal variable with two categories | Readmitted yes/no, passed/failed, alive/dead |
Identify both your outcome (dependent) variable and your predictor or grouping (independent) variable. For example, in "Does a new teaching method improve exam scores?", the outcome is exam score (continuous) and the predictor is teaching method (nominal, two groups).
Likert-type data cause frequent debate. A single Likert item is ordinal. A total score summed from many items is often treated as continuous, especially if it has a wide range and a reasonable distribution. State and justify your choice.
Step 2: Parametric or non-parametric?
Parametric tests (t-tests, ANOVA, Pearson correlation, linear regression) make assumptions about the data, typically that the outcome (or the residuals) is approximately normally distributed, that variances are similar between groups, and that observations are independent. When those assumptions hold, parametric tests are more powerful.
Non-parametric tests (Mann-Whitney U, Wilcoxon, Kruskal-Wallis, Spearman) make fewer assumptions. They are usually based on ranks and are appropriate for ordinal outcomes, for continuous outcomes that are clearly skewed with small samples, or when there are extreme outliers.
- Check normality with histograms and Q-Q plots, not just with Shapiro-Wilk tests, which flag trivial departures in large samples and miss important ones in small samples.
- With larger samples, t-tests and ANOVA are fairly robust to moderate non-normality.
- Unequal variances? Use Welch's t-test, which many statisticians recommend as the default for comparing two means, or Welch's ANOVA.
Step 3: Tests for comparing groups
| Outcome | Groups | Independent groups | Paired / repeated |
|---|---|---|---|
| Continuous (normal) | 2 | Independent-samples t-test (Welch) | Paired t-test |
| Continuous (not normal) or ordinal | 2 | Mann-Whitney U test | Wilcoxon signed-rank test |
| Continuous (normal) | 3 or more | One-way ANOVA | Repeated-measures ANOVA |
| Continuous (not normal) or ordinal | 3 or more | Kruskal-Wallis test | Friedman test |
| Categorical | 2 or more | Chi-square test of independence (Fisher's exact for small expected counts) | McNemar test (binary, 2 time points) |
Independent-samples t-test
Compares the means of two independent groups, for example exam scores for students taught with method A versus method B (NIST/SEMATECH, n.d.-c). Calculate it with our t-test calculator, and see our step-by-step guide to the independent-samples t-test in SPSS.
Paired t-test
Compares two related measurements, such as blood pressure before and after an intervention in the same patients. The analysis is based on the differences within each pair.
One-way ANOVA
Compares means across three or more independent groups, such as pain scores for three analgesics (NIST/SEMATECH, n.d.-b); see our worked one-way ANOVA in SPSS example, or the 2 × 2 factorial ANOVA guide when you have two independent variables. A significant ANOVA tells you that at least one group differs; follow it with post hoc tests (for example Tukey's HSD) to find which. Try the ANOVA calculator.
Mann-Whitney U and Kruskal-Wallis
Rank-based alternatives to the independent t-test and one-way ANOVA, suitable for ordinal or skewed outcomes. See the Mann-Whitney U calculator and Kruskal-Wallis calculator.
Chi-square and Fisher's exact test
Test whether two categorical variables are associated, for example whether infection rates differ between two wound dressings (NIST/SEMATECH, n.d.-a). Our chi-square test of independence guide walks through the SPSS output. The chi-square test relies on expected counts that are not too small; a common rule of thumb is that most expected counts should be at least 5. When they are not, especially in 2×2 tables, use Fisher's exact test. Use our chi-square calculator and Fisher's exact test calculator.
McNemar test
For paired binary data, such as the same patients classified as anxious or not before and after an intervention. Try the McNemar test calculator.
Step 4: Tests for relationships and prediction
| Question | Variables | Test |
|---|---|---|
| Are two variables associated? | Two continuous, roughly linear and normal | Pearson correlation (r) |
| Are two variables associated? | Ordinal, skewed or with outliers | Spearman rank correlation (rho) |
| Does X predict a continuous outcome? | One or more predictors, continuous outcome | Linear regression |
| Does X predict a binary outcome? | One or more predictors, yes/no outcome | Logistic regression |
| Does X predict time to an event? | Predictors, survival time with censoring | Cox proportional hazards regression; Kaplan-Meier and log-rank test to compare groups |
| Do two raters agree? | Categorical ratings | Cohen's kappa |
| Do two raters or measurements agree? | Continuous ratings | Intraclass correlation coefficient (ICC) |
Correlation measures association, not causation, and Pearson's r only captures linear relationships. Always plot the data first. Our correlation calculator computes Pearson and Spearman coefficients with confidence intervals, and the linear regression and logistic regression calculators handle prediction.
Regression is often the most flexible choice, because it lets you adjust for confounders. A t-test is actually a special case of linear regression with one binary predictor, and ANOVA is linear regression with a categorical predictor.
Worked examples: matching questions to tests
| Research question | Outcome | Groups / design | Test |
|---|---|---|---|
| Do nursing students who use simulation score higher on a skills exam than those who don't? | Exam score (continuous) | 2 independent groups | Independent t-test (Mann-Whitney if skewed) |
| Does anxiety fall after a mindfulness course? | Anxiety score (continuous) | Same people, before and after | Paired t-test (Wilcoxon if skewed) |
| Do satisfaction ratings differ across three clinics? | Rating (ordinal, 1–5) | 3 independent groups | Kruskal-Wallis test |
| Is smoking status associated with post-operative infection? | Infection yes/no | Smoker vs non-smoker | Chi-square (Fisher's if small counts) |
| Is hours of sleep related to reaction time? | Reaction time (continuous) | Two continuous variables | Pearson correlation, or linear regression |
| Which factors predict 30-day readmission? | Readmitted yes/no | Several predictors | Logistic regression |
| Does blood pressure change across four time points? | BP (continuous) | Same people, 4 times | Repeated-measures ANOVA or a mixed model |
Beyond the p value: effect sizes, confidence intervals and power
A statistical test gives a p value, but a p value alone does not tell you how big or important an effect is. Report an effect size and its 95% confidence interval alongside every test.
| Effect size | Small | Medium | Large |
|---|---|---|---|
| Cohen's d (difference between two means) | 0.2 | 0.5 | 0.8 |
| r (correlation) | 0.1 | 0.3 | 0.5 |
Cohen (1992) offered these benchmarks as rough guides when nothing better is available. Where possible, interpret effect sizes in the context of your field and what matters practically.
Before collecting data, calculate the sample size needed to detect a meaningful effect with adequate power (conventionally 80% or 90%) at your chosen alpha (usually 0.05). Underpowered studies often produce non-significant results that are simply inconclusive.
Checking assumptions before you run the test
Every test rests on assumptions. Check them before interpreting results, and report what you checked:
| Test | Main assumptions | If violated |
|---|---|---|
| Independent t-test | Independent observations; outcome roughly normal in each group; similar variances | Welch's t-test for unequal variances; Mann-Whitney U for skewed small samples |
| Paired t-test | Differences between pairs roughly normal | Wilcoxon signed-rank test |
| One-way ANOVA | Independence; normal residuals; equal variances | Welch's ANOVA; Kruskal-Wallis test |
| Chi-square | Independent observations; adequate expected counts | Fisher's exact test; combine sparse categories if meaningful |
| Pearson correlation | Linear relationship; no extreme outliers; roughly normal variables | Spearman correlation; transform variables |
| Linear regression | Linearity; independent, normally distributed residuals with constant variance; no severe multicollinearity | Transformations, robust standard errors, or a different model |
| Logistic regression | Independent observations; linear relationship between continuous predictors and the log odds; enough events per predictor | Fewer predictors, penalised methods, or combining categories |
One-tailed or two-tailed? And what about multiple tests?
Use two-tailed tests by default. A one-tailed test is only justified when an effect in the opposite direction would be impossible or of no interest, and the direction was specified before seeing the data. Reviewers are rightly suspicious of one-tailed tests chosen to cross the significance threshold.
If you run many tests, the chance of at least one false positive rises quickly. Pre-specify a small number of primary analyses, and adjust for multiple comparisons where appropriate, for example with post hoc procedures after ANOVA, a Bonferroni correction for a few planned comparisons, or false discovery rate control for many tests.
Running the tests: SPSS, R, Stata, jamovi and Excel
All the tests above are available in standard statistical software. SPSS is common in health and social sciences; R is free and powerful; Stata is popular in epidemiology and economics; jamovi and JASP are free, point-and-click programs built on R; Excel can run basic t-tests and correlations but is limited and error-prone for anything more complex. Whatever you use, record the exact procedure and software version so your analysis can be reproduced.
Common mistakes when choosing a statistical test
- Running several t-tests instead of ANOVA when comparing three or more groups, which inflates the false positive rate.
- Using an independent test for paired data (or vice versa).
- Using a chi-square test with very small expected counts.
- Treating a single Likert item as continuous without justification.
- Interpreting a non-significant result as proof of no effect.
- Reporting p values without effect sizes and confidence intervals.
- Choosing a test after seeing which one gives a significant result.
Getting help with your statistics
If you are still unsure which test fits your design, or you need help running and interpreting the analysis, our statistical data analysis service works in SPSS, R, Stata and more, and explains each result in plain language. Once your analysis is done, see how to report statistics in APA 7.
Frequently asked questions
How do I know which statistical test to use?
Identify your aim (comparing groups or examining relationships), the type of your outcome variable (continuous, ordinal or categorical), and the number of groups and whether they are independent or paired. These three answers point to the right test.
When should I use a t-test vs ANOVA?
Use a t-test to compare the means of two groups. Use ANOVA for three or more groups, followed by post hoc tests to identify which groups differ.
When should I use a non-parametric test?
Use a non-parametric test when your outcome is ordinal, or when a continuous outcome is clearly non-normal with a small sample or has extreme outliers.
What test do I use for two categorical variables?
Use a chi-square test of independence, or Fisher's exact test when expected counts are small, particularly in 2×2 tables. For paired binary data use McNemar's test.
What is the difference between correlation and regression?
Correlation measures the strength and direction of an association between two variables. Regression models how one or more predictors relate to an outcome, allowing prediction and adjustment for confounders.
What test should I use for Likert scale data?
For a single Likert item, use non-parametric tests such as Mann-Whitney U or Kruskal-Wallis. Summed scale scores with many items are often analysed with parametric tests if the distribution is reasonable.