
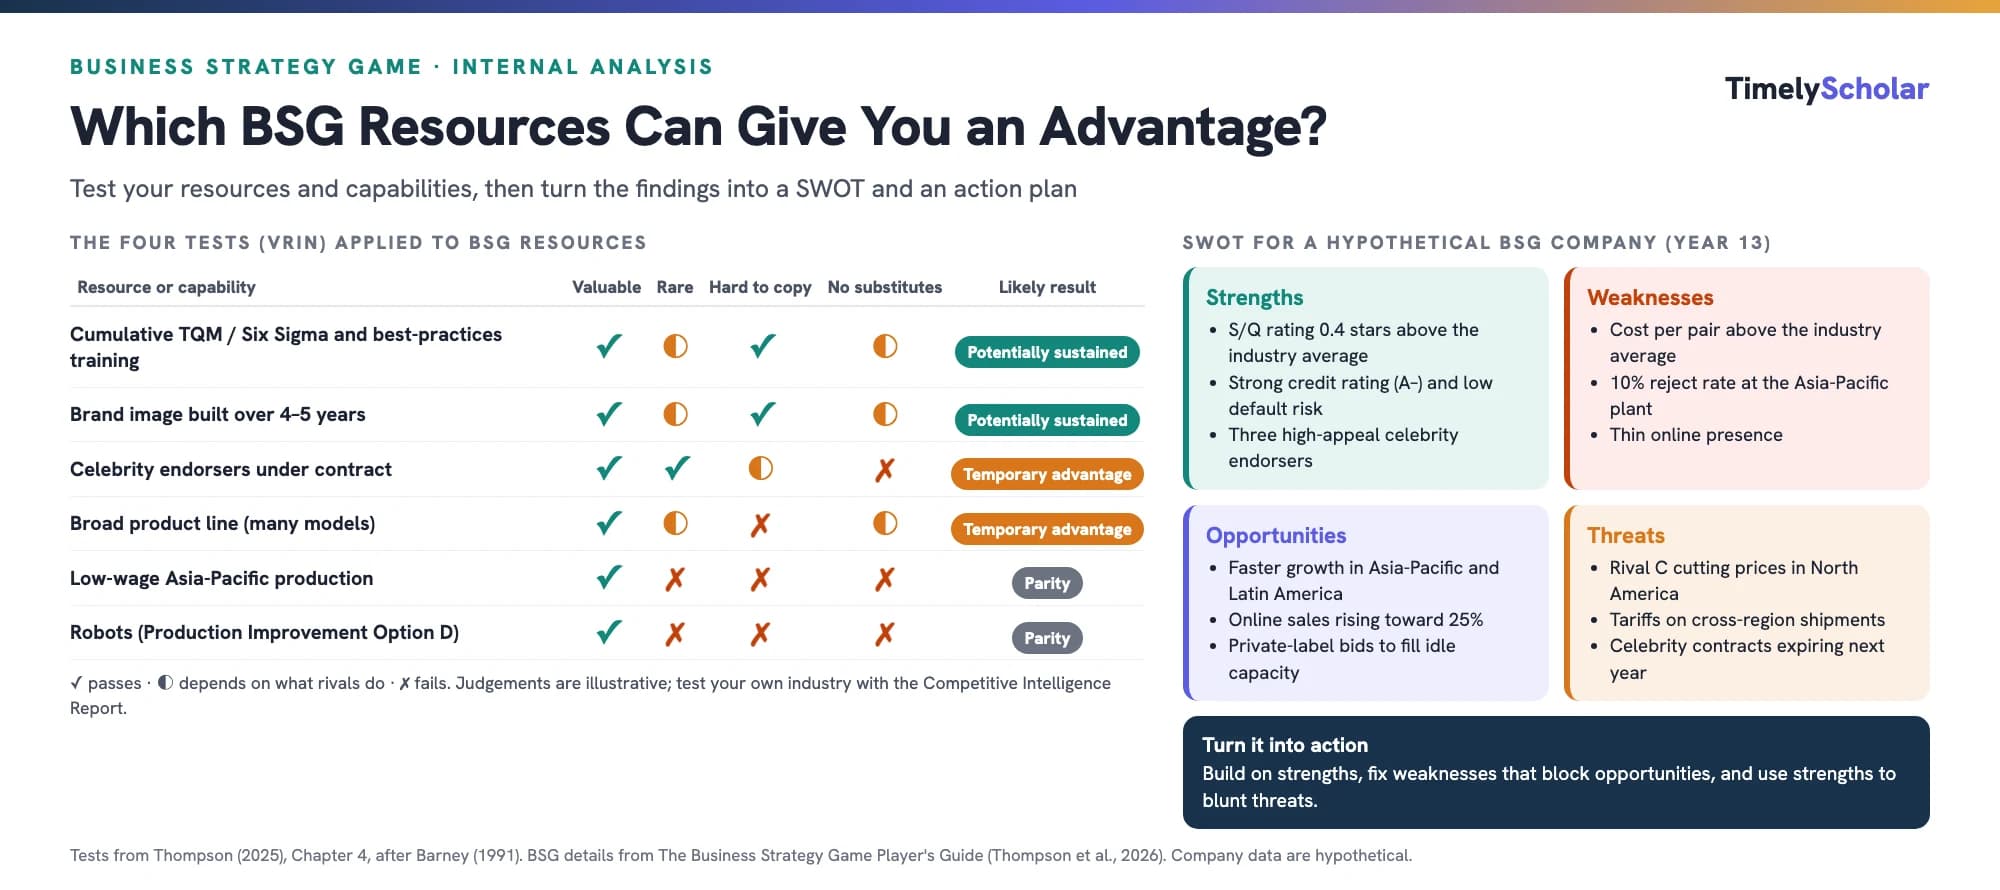
Internal analysis in the Business Strategy Game (BSG) asks six questions (Thompson, 2025). Is the strategy working? Check your board targets, scores and regional market shares. Which resources and capabilities matter? Test each with the VRIN questions: is it valuable, rare, hard to copy and free of substitutes? Cumulative quality and training investment and a long-built image tend to pass; low-wage plants and robots do not. What are your strengths, weaknesses, opportunities and threats? Turn the SWOT into actions. Are your costs and prices competitive? Use value chain analysis and the Footwear Industry Report's benchmarking pages. Are you stronger or weaker than rivals? Run a weighted competitive strength assessment. What must you fix next? List the strategic issues, which then feed your 3-Year Strategic Plan.
Playing the Business Strategy Game? Get coaching on strategy and the reports. Get a free quote →
Internal analysis in BSG: from the industry to your own company
Strategy needs two diagnoses. External analysis asks what the industry rewards; internal analysis asks what your company has and does well, what it costs, and how it compares with rivals (Thompson, 2025). If you have not yet analysed the footwear industry, start with our guide to BSG industry analysis with the five forces, PESTEL and key success factors, then use this guide for the inside view.
Thompson (2025) structures internal analysis around six questions, and the Business Strategy Game supplies data for every one of them. The Player's Guide notes that the simulation provides strategic group maps, lists of your company's and its rivals' competitive strengths and weaknesses, benchmarking data and competitive intelligence, so teams can practise these tools (Thompson et al., 2026). That practice is the point: a recent systematic review found that business simulation games generally strengthen students' decision-making (Velez & Alonso, 2025).
The six questions of internal analysis and where to find the answers in BSG
| Question | Main tools | BSG reports to use |
|---|---|---|
| 1. How well is the strategy working? | Performance against objectives; financial ratios | Footwear Industry Report scoreboard; Performance Highlights |
| 2. Which resources and capabilities matter? | Resource and capability analysis; VRIN tests | Company Operating Reports; Competitive Intelligence Report |
| 3. What are the strengths, weaknesses, opportunities and threats? | SWOT analysis | All reports, plus industry forecasts |
| 4. Are costs and prices competitive? | Value chain analysis; benchmarking | Benchmarking pages of the Footwear Industry Report |
| 5. Are we stronger or weaker than rivals? | Weighted competitive strength assessment | Comparative Competitive Efforts report |
| 6. What strategic issues must we address? | A "worry list" | Everything above; feeds the 3-Year Strategic Plan |
Question 1: Is your BSG strategy working?
Thompson (2025) names three telling indicators: whether the company is meeting its financial and strategic objectives, whether it performs above the industry average, and whether it is gaining customers and market share. Shrinking share, missed targets and mediocre results relative to rivals signal a weak strategy, weak execution or both.
In BSG, the objectives are set for you. The board expects rising earnings per share (EPS), return on equity (ROE), stock price, credit rating and image rating every year, and your score combines an Investor Expectations standard (meeting or beating those targets) with a Best-in-Industry standard (how you compare with the top performer) (Thompson et al., 2026). Read the scoreboard pages of the Footwear Industry Report, the trend lines in the Performance Highlights report and your market share in each region before anything else.
Key BSG performance measures and what drives them
| Measure | How BSG defines it | What moves it |
|---|---|---|
| Earnings per share | Net income divided by shares outstanding | Profit growth; share repurchases reduce the share count |
| Return on equity | Net income divided by the average of beginning and ending shareholder equity | Profitability and how the company is financed |
| Credit rating | Based on interest coverage (operating profit ÷ interest), debt-to-assets and the default risk ratio (cash flow from operations ÷ annual principal payments) | A default risk ratio below 2.0 counts as high risk, 2.0–4.0 as medium and 4.0 or more as low risk |
| Image rating | Global average branded S/Q rating, global market share and corporate citizenship over the past 4–5 years | Quality, share and social responsibility spending |
| Stock price | Driven by revenue and EPS growth, ROE, credit rating, dividends and consistency in meeting targets | Sustained performance on all of the above |
These definitions come from the Player's Guide (Thompson et al., 2026). Tracking them each year is your version of the financial ratio analysis Thompson (2025) recommends.
Question 2: Your BSG company's resources and capabilities
A resource is an asset the company owns or controls; a capability is how proficiently it performs an activity (Thompson, 2025). The resource-based view of strategy holds that lasting competitive advantage comes from resources and capabilities that rivals cannot easily match (Barney, 1991), and recent work frames them as the source of the value a company creates for customers and captures for itself (Barney et al., 2021).
Types of resources, with BSG examples
| Type of resource | BSG examples |
|---|---|
| Physical | Production facilities and capacity in each region; new or refurbished equipment; production improvement options |
| Human | Worker productivity (about 5,000 pairs per worker a year in North America and 3,500 in Asia-Pacific in Year 10) and the skill built by best-practice training |
| Organisational | Cumulative TQM/Six Sigma programmes and quality systems |
| Financial | Cash, borrowing capacity and the credit rating |
| Intangible | Brand image, S/Q reputation, the goodwill reflected in the image rating |
| Relationships | The retailer network and celebrity endorsement contracts |
Examples from the Player's Guide (Thompson et al., 2026).
Competence, core competence and distinctive competence
A competence is an activity the company has learned to perform consistently well at an acceptable cost.
A core competence is a competence that is central to the company's strategy and competitiveness.
A distinctive competence is a competitively important activity the company performs better than its rivals, which gives it competitive advantage potential (Thompson, 2025).
In BSG, a team pursuing differentiation might build a core competence in producing high-S/Q footwear efficiently. If its cumulative quality investment and training let it reach a given S/Q rating at a lower cost per pair than any rival, that becomes a distinctive competence. Thompson (2025) also stresses dynamic capability, the ability to keep building and reshaping capabilities as conditions change (Teece et al., 1997). For BSG, this means adjusting its resource base, such as adding capacity in faster-growing regions, as the industry evolves.
VRIN and VRIO analysis for BSG resources
Not every resource can produce an advantage. Thompson (2025) tests the competitive power of a resource or capability with four questions, which follow Barney's (1991) conditions for sustained advantage and are often abbreviated VRIN:
Valuable: does it help the company attract customers or compete more effectively?
Rare: do few or no rivals have it? A resource most rivals share only gives parity.
Inimitable (hard to copy): would rivals find it slow, difficult or costly to copy? Resources built up over time are usually hardest to imitate.
Non-substitutable: can rivals achieve the same result with a different resource?
A widely taught variant, VRIO, keeps the first three tests and replaces the fourth with a question about organisation: is the company set up to exploit the resource? Either way, the logic is the same: the more tests a resource passes, the more durable the advantage it can support.
Some patterns from the Player's Guide (Thompson et al., 2026) explain the results above:
Cumulative quality spending and training are hard to copy because the S/Q formula rewards cumulative TQM/Six Sigma spending more than current-year spending, so a rival that starts late cannot catch up in one year.
Celebrity endorsers are rare because each signs with the highest bidder, but contracts last only two or three years and rivals can win other celebrities, so the advantage is temporary.
Low-wage production and robots are valuable but available to every company, so they bring parity rather than advantage. Thompson (2025) gives the same warning about automation that rivals can also adopt.
Question 3: How to do a SWOT analysis for BSG
SWOT analysis lists a company's internal strengths and weaknesses and its external opportunities and threats. It remains one of the most widely used strategic planning tools (Benzaghta et al., 2021), but Thompson (2025) stresses that the list is only the first of three steps:
Identify the competitively important strengths, weaknesses, opportunities and threats.
Draw conclusions about the company's overall situation: how strong is it, on a scale from alarmingly weak to exceptionally strong, and what is attractive or unattractive about it?
Translate the findings into strategic action: build the strategy on the strongest resources, pursue the opportunities those strengths fit, correct weaknesses that block opportunities or increase exposure to threats, and use strengths to blunt threats.
Where to find SWOT evidence in BSG
| SWOT element | Typical BSG evidence |
|---|---|
| Strengths | S/Q rating above the regional average; low cost per pair; strong credit rating; celebrity lineup; wide retailer network |
| Weaknesses | Costs above benchmark; high reject rates; low productivity; weak online sales; unsold inventory |
| Opportunities | Faster demand growth in Asia-Pacific and Latin America; the shift to online buying; private-label contracts for idle capacity |
| Threats | Rivals' price cuts or quality jumps; tariff and exchange rate changes; materials price rises; expiring celebrity contracts |
A good BSG SWOT is specific and evidence-based ("S/Q rating 0.4 stars above the Europe-Africa average", not "good quality") and ends with actions. For more on turning the external half of the SWOT into opportunities and threats, see our BSG industry analysis guide.
Question 4: Value chain analysis and benchmarking in BSG
A company's value chain is the set of primary and support activities it performs to design, make, sell and deliver its product, each of which adds cost and, ideally, value (Thompson, 2025). Mapping your costs activity by activity shows whether your prices are justified by the value you deliver and whether your costs are competitive with rivals offering similar value.
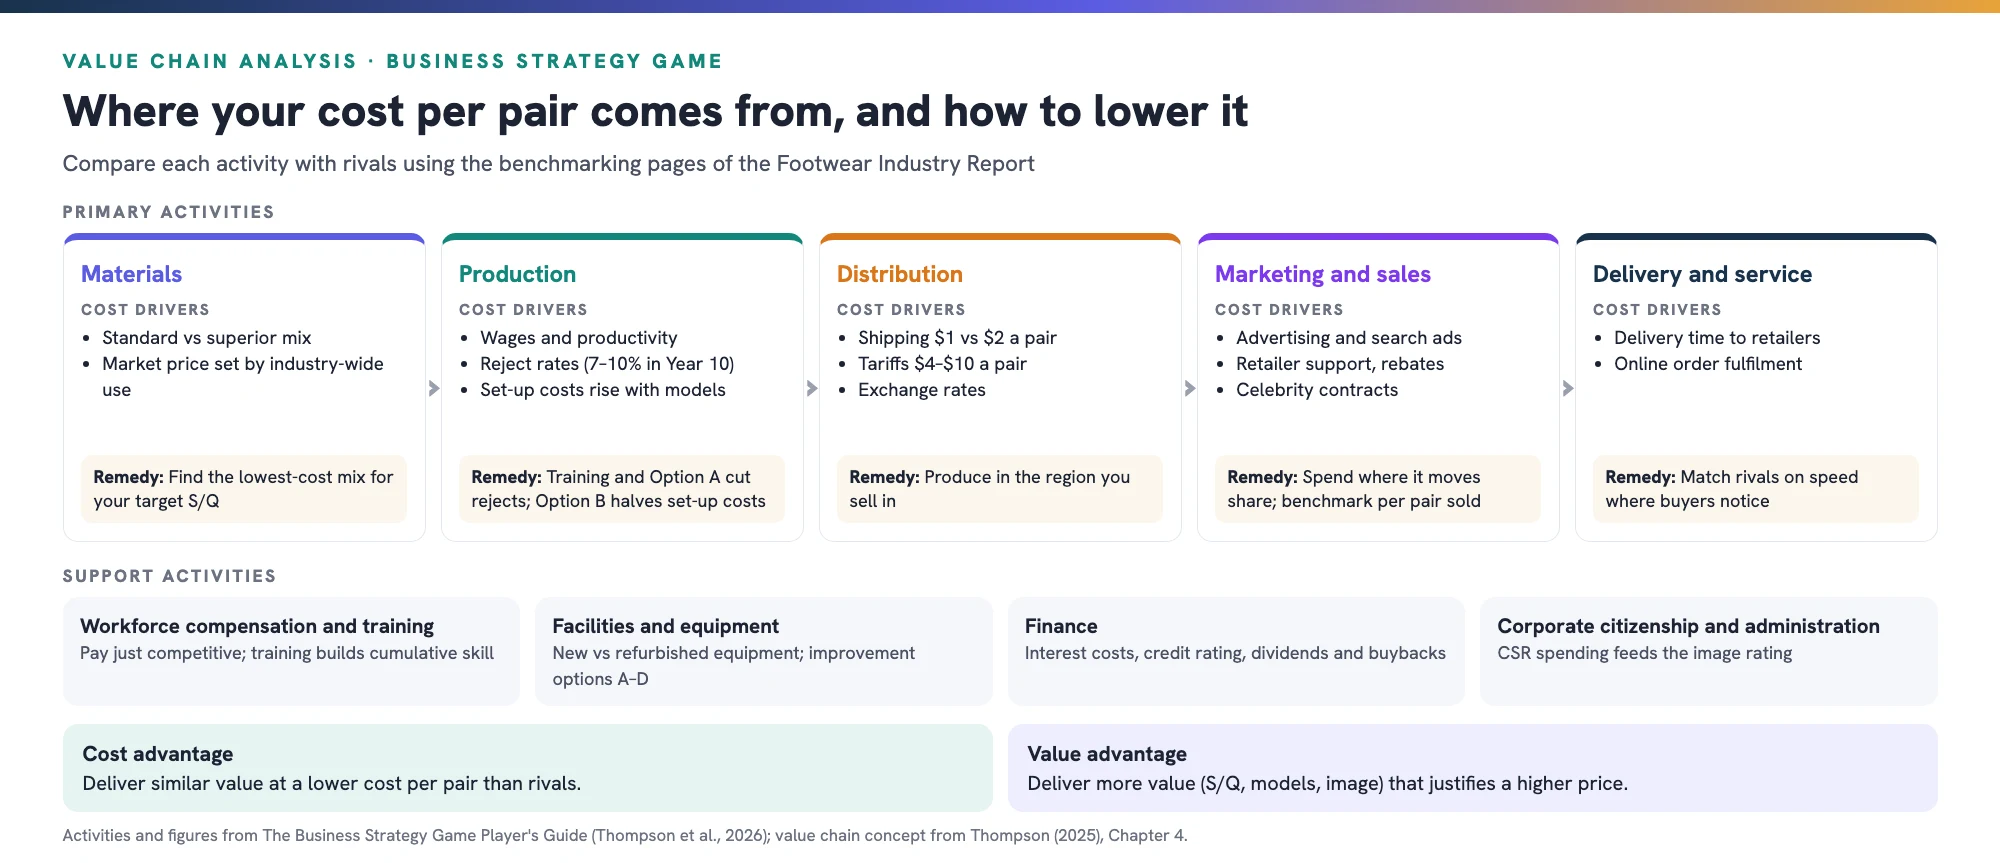
The BSG value chain: where cost per pair comes from and where to look for savings.
Benchmarking compares how well and at what cost different companies perform each activity, to identify and copy best practices (Thompson, 2025). BSG builds this in: the Footwear Industry Report includes two pages of benchmarking data comparing your costs with rivals' (Thompson et al., 2026). Review them every round and look for activities where your cost per pair is out of line.
Fixing a cost disadvantage
Thompson (2025) identifies three places to look: your own internal activities, supplier-related activities and forward channel activities. In BSG, examples include:
Internal activities. Reject rates of 7% and 10.1% at the two original plants cost about $14.5 million on branded pairs in Year 10; best-practices training and Production Improvement Option A (which halves the reject rate) attack this directly. Production set-up costs climb from $1 million a year for 50 models to $15 million for 500 per facility, so a broad product line needs Option B (which halves set-up costs) or larger plants to stay cost-competitive (Thompson et al., 2026).
Supplier-related activities. Find the lowest-cost combination of superior materials, styling spending, TQM and training that reaches your target S/Q rating, since several combinations can achieve the same rating at different costs (Thompson et al., 2026).
Forward channel activities. Producing in the region where you sell avoids cross-region shipping and tariffs, and spending on retailer support and advertising should be judged per pair sold against the benchmarks.
Question 5: Weighted competitive strength assessment for BSG
A weighted competitive strength assessment rates your company and its main rivals on the measures that matter most, weighted by importance, to show whether you have a net advantage or disadvantage (Thompson, 2025). The steps are:
List six to ten key success factors and measures of competitive strength.
Weight each by importance, so that the weights add up to 1.0.
Rate each company from 1 (very weak) to 10 (very strong) on each measure.
Multiply each rating by its weight.
Add the weighted scores for each company.
Compare the totals and note where each company is strongest and weakest.
Illustrative weighted competitive strength assessment for a BSG region (ratings 1–10; weighted score in brackets)
| Strength measure | Weight | Your company | Rival A | Rival B |
|---|---|---|---|---|
| S/Q rating relative to price | 0.20 | 8 (1.60) | 6 (1.20) | 7 (1.40) |
| Cost per pair delivered | 0.20 | 6 (1.20) | 8 (1.60) | 5 (1.00) |
| Brand image (advertising, celebrities) | 0.15 | 7 (1.05) | 5 (0.75) | 8 (1.20) |
| Number of models offered | 0.10 | 7 (0.70) | 5 (0.50) | 8 (0.80) |
| Retailer network and support | 0.10 | 6 (0.60) | 7 (0.70) | 6 (0.60) |
| Online sales effort | 0.10 | 5 (0.50) | 7 (0.70) | 6 (0.60) |
| Financial strength (credit rating) | 0.10 | 8 (0.80) | 6 (0.60) | 5 (0.50) |
| Production efficiency | 0.05 | 7 (0.35) | 8 (0.40) | 4 (0.20) |
| Overall weighted strength | 1.00 | 6.80 | 6.45 | 6.30 |
In this hypothetical case, your company leads overall, but narrowly, and Rival A's cost advantage is a real threat: if Rival A also improves its S/Q rating, the lead disappears. The value of the exercise is in that kind of conclusion. Base your ratings on the Comparative Competitive Efforts page of the Competitive Intelligence Report and the benchmarking data rather than impressions, and set the weights to reflect what buyers in your industry actually respond to.
Question 6: The strategic issues your BSG team must address
The last step pulls the internal and external analysis into a "worry list": the specific issues management must resolve, phrased as "how to…", "whether to…" and "what to do about…" (Thompson, 2025). For a BSG company, it might read:
How to bring cost per pair down to the industry benchmark without losing S/Q rating.
Whether to build capacity in Latin America or Europe-Africa before demand growth peaks.
What to do about Rival A's price cuts in North America.
Whether to renew the expiring celebrity contracts or shift spending to advertising and online sales.
How to lift the image rating to meet the board's rising target.
Each item becomes an agenda point for your next decisions, and the full list is the backbone of the 3-Year Strategic Plan.
Using internal analysis in BSG capstone assignments
Most BSG courses ask for written or presented work alongside the decisions. Internal analysis supplies the evidence for each:
3-Year Strategic Plan. The plan module, available from Year 14, asks for a strategic vision, financial and strategic objectives, sales and market share targets, projected costs per pair and projected income statements for the next three years (Thompson et al., 2026). Your SWOT, value chain and strength assessment show what is achievable and which issues the plan must solve.
Situation analysis or SWOT papers. Combine the industry analysis with the internal analysis in this guide, cite your reports as evidence, and end with recommended actions.
Presentations and reflections. Use the Performance Highlights trends to show how your strategy and resources developed, which decisions built lasting strengths, and what you would change.
For how strategy, vision and objectives fit together, see vision, mission and objectives in BSG and how to craft a strategy that beats your rivals in BSG. If you are starting out, our BSG Year 11 strategy guide covers the first decision round.
Common internal analysis mistakes in BSG
Calling everything a strength. Only resources that pass at least the first VRIN tests matter competitively.
A SWOT that stops at the list. Thompson (2025) is clear that the conclusions and actions are the purpose.
Vague SWOT entries without numbers from your reports.
Ignoring cost benchmarks because sales look good; good sales are not enough if costs eat the profit.
Equal weights in a competitive strength assessment, which hides what buyers actually care about.
Chasing short-term savings that destroy cumulative assets, such as cutting TQM or training spending that took years to build.
Getting help with your BSG analysis
If you would like a strategy specialist to talk through your SWOT, value chain or 3-Year Strategic Plan, see our Business Strategy Game coaching. We explain the reasoning so your team makes its own decisions, in line with your course's rules.
Frequently asked questions
How do you do a SWOT analysis for the Business Strategy Game?
List strengths and weaknesses from your company's reports (S/Q rating, cost per pair, credit rating, image rating, celebrity lineup) and opportunities and threats from the industry forecasts and rivals' moves. Then draw conclusions about your overall position and turn each finding into an action.
What is VRIO analysis and how does it apply to BSG?
VRIO asks whether a resource is valuable, rare, hard to imitate and supported by the organisation; the closely related VRIN framework asks whether it is non-substitutable. In BSG, cumulative quality investment and a long-built image tend to pass most tests, while low-wage plants and robots, which every company can adopt, do not.
What is value chain analysis in BSG?
Breaking your cost per pair into activities such as materials, production, distribution, marketing and delivery, then comparing each with rivals using the benchmarking pages of the Footwear Industry Report to find where costs are out of line.
How do you do a weighted competitive strength assessment?
List six to ten key success factors, weight them so the weights sum to 1.0, rate your company and rivals from 1 to 10 on each, multiply ratings by weights, and add them up to compare overall competitive strength.
What is the difference between a core competence and a distinctive competence?
A core competence is an activity a company performs well that is central to its strategy. A distinctive competence is one it performs better than its rivals, which gives it competitive advantage potential.
How is the credit rating determined in BSG?
By three measures: interest coverage, the debt-to-assets ratio and the default risk ratio. A default risk ratio below 2.0 counts as high risk, 2.0 to 4.0 as medium risk and 4.0 or more as low risk.
What goes into a BSG 3-Year Strategic Plan?
A strategic vision, financial and strategic objectives, sales and market share targets for branded and private-label footwear, projected costs per pair and projected income statements for the next three years. The module becomes available from Year 14.
Which BSG reports are most useful for internal analysis?
The Footwear Industry Report (scoreboard and benchmarking pages), the Company Operating Reports, the Performance Highlights report and the Comparative Competitive Efforts page of the Competitive Intelligence Report.
Sources
- Thompson AA. Strategy: Core Concepts and Analytical Approaches. 8th ed. (2025-2026). McGraw Hill; 2025. Chapter 4: Evaluating a company's resources, capability, and ability to compete successfully
- Thompson AA, Stappenbeck GJ, Reidenbach MA. The Business Strategy Game Player's Guide. 2026 ed. GLO-BUS Software; 2026
- Barney J. Firm resources and sustained competitive advantage. J Manage 1991;17(1):99-120
- Barney JB, Ketchen DJ, Wright M. Resource-based theory and the value creation framework. J Manage 2021;47(7):1936-1955
- Teece DJ, Pisano G, Shuen A. Dynamic capabilities and strategic management. Strateg Manag J 1997;18(7):509-533
- Benzaghta MA, Elwalda A, Mousa MM, Erkan I, Rahman M. SWOT analysis applications: an integrative literature review. J Glob Bus Insights 2021;6(1):55-73
- Velez A, Alonso RK. Business simulation games for the development of decision making: systematic review. Educ Sci 2025;15(2):168