
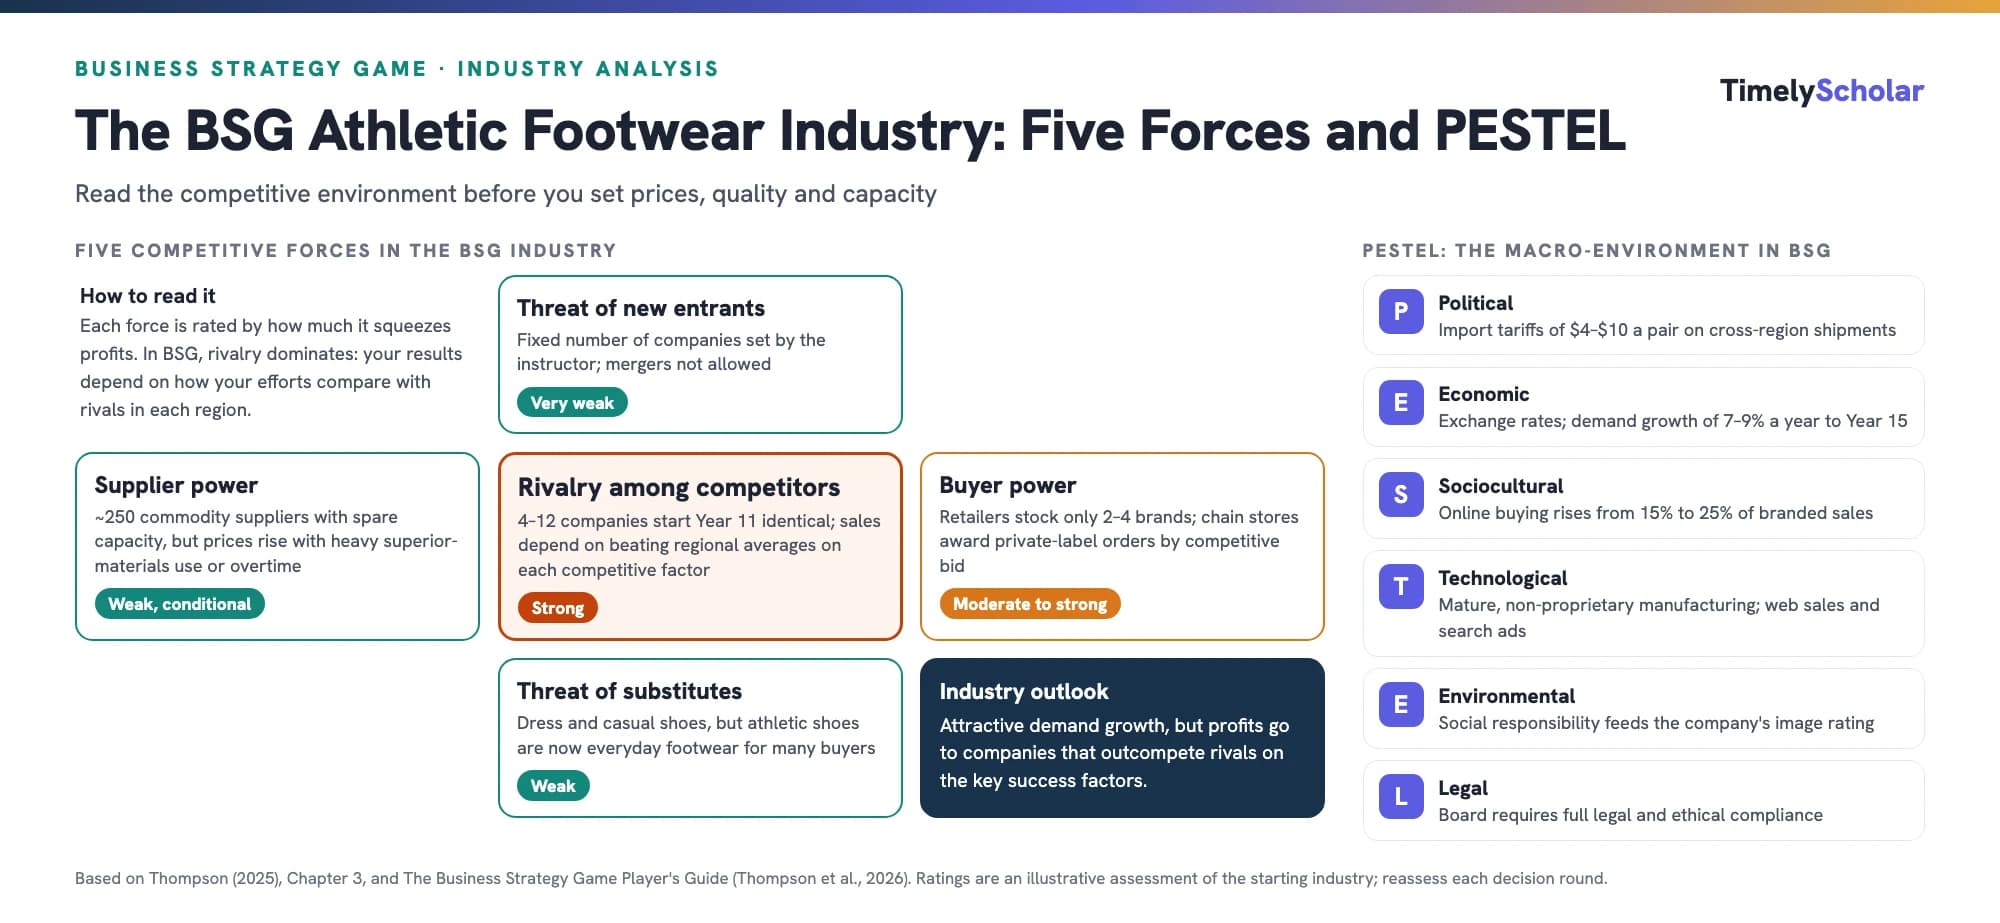
To analyse the external environment in the Business Strategy Game (BSG), work through the same questions a strategist asks about any industry (Thompson, 2025). Use PESTEL for the macro-environment: in BSG that means import tariffs, exchange rates, regional demand growth and the shift to online buying. Use Porter's five forces for the industry: rivalry among the 4–12 companies is strong, because sales depend on how each company's efforts compare with the regional average; buyer power is moderate to strong; supplier power is weak but rises when materials demand or overtime runs high; and new entrants and substitutes are weak. Then identify the driving forces of change, map rivals into strategic groups, predict rivals' next moves from the Competitive Intelligence Report, and pick the two or three key success factors on which you will match or beat rivals.
Playing the Business Strategy Game? Get coaching on strategy and the reports. Get a free quote →
Why external environment analysis matters in BSG
In strategy, choosing a direction starts with diagnosing the company's situation: first the external environment, then the company's own resources and capabilities. Only then do managers set a vision, weigh strategic options and pick a strategy and business model (Thompson, 2025). Skipping the diagnosis is how teams end up with a strategy that does not fit the market they are actually competing in.
The Business Strategy Game makes this unusually concrete. Every company starts Year 11 in an identical position, and each region's unit sales and market shares are decided entirely by how each company's competitive efforts compare with those of its rivals (Thompson et al., 2026). The simulation has no built-in preference for any one strategy, so a choice that works brilliantly in one class can fail in another. Reading your own industry carefully, round after round, is the only reliable way to decide what to do.
That is also why simulations are used in strategy courses. A recent systematic review found that business simulation games generally improved university students' decision-making, especially when the experience was well structured (Velez & Alonso, 2025). The tools in this guide are that structure.
PESTEL analysis: the BSG macro-environment
A company's external environment has two layers: the immediate industry and competitive environment, and the wider macro-environment around it. PESTEL analysis scans six kinds of macro-environmental factors: political, economic, sociocultural, technological, environmental and legal or regulatory and asks which changes are strategically relevant enough to require a response (Thompson, 2025). In BSG, most of these factors are built into the simulation:
| Factor | What it looks like in BSG | Why it matters for decisions |
|---|---|---|
| Political | Import tariffs on footwear shipped between regions, from $4 to $10 a pair depending on the route, with future levels uncertain | Exporting from a low-wage region can lose its cost advantage once tariffs and cross-region shipping are added |
| Economic | Real-world exchange rates adjust both production costs and overseas revenues; global demand grows 7–9% a year to Year 15, then 5–7% | Currency swings and regional growth rates change where it pays to produce and sell |
| Sociocultural | Athletic shoes have become everyday footwear for many buyers; online purchases rise from 15% of branded sales to 25% by Year 20 | The online channel grows every year, so website pricing and search advertising matter more over time |
| Technological | Footwear manufacturing is mature and well understood, with no proprietary know-how; training in best practices lowers reject rates | Cost advantage comes from efficiency, training and facility choices rather than secret technology |
| Environmental | Actions that show corporate citizenship and social responsibility feed into the company's image rating | Image rating is one of the five performance targets the board sets |
| Legal/regulatory | The board requires full compliance with laws and ethical conduct, and does not allow mergers | Strategy must grow the company organically within the rules |
These details come from the Player's Guide (Thompson et al., 2026). Note that the guide warns against concluding that production should be concentrated in low-wage regions just because base wages there run about 35% of those in North America and Europe-Africa: productivity, training, equipment, tariffs and exchange rates all change the real cost per pair delivered.
Porter's five forces analysis of the BSG footwear industry
Porter's (2008) five forces model explains how much profit an industry allows by looking at five sources of competitive pressure: rivalry among existing competitors, the threat of new entrants, the threat of substitutes, and the bargaining power of suppliers and of buyers. Thompson (2025) applies it in three steps: identify the specific pressures behind each force, rate each one (fierce, strong, moderate or weak) and judge whether their combined strength still leaves room for good profits.
1. Rivalry among competing sellers: strong
Rivalry tends to be stronger when rivals are similar in size and capability, products are weakly differentiated, buyers can switch cheaply, and some companies are unhappy with their results and willing to make aggressive moves (Thompson, 2025). BSG starts with almost every one of those conditions: 4 to 12 companies begin with identical sales, costs and footwear, and buyers compare them on 11 competitive factors, from price and S/Q rating to the number of models, advertising, celebrity endorsements, retailer support, delivery times and online effort (Thompson et al., 2026). Because sales depend on beating the regional average on those factors, any company that falls behind is under pressure to respond, which keeps rivalry intense. The healthy demand growth of 7–9% a year through Year 15 softens it a little, since there are new sales to win without taking them all from rivals.
2. Threat of new entrants: very weak
The number of companies is fixed by the instructor, and the board does not allow mergers, so no newcomer can enter the market or buy its way in (Thompson et al., 2026). The practical point is that all competitive pressure comes from the companies already in your class.
3. Threat of substitutes: weak
Dress and casual shoes are the obvious substitutes, but the Player's Guide describes athletic shoes as the everyday choice for children and teenagers and increasingly for adults, because of comfort and price (Thompson et al., 2026). Substitutes exist but put little pressure on the industry.
4. Supplier bargaining power: weak, but conditional
Suppliers have little power when the input is a commodity available from many sources at the going price, switching is cheap and supplies are ample (Thompson, 2025). That describes BSG's materials market: about 250 suppliers, standard and superior grades of identical quality across suppliers, delivery in under 48 hours and plenty of capacity. Supplier power appears only in two situations. Superior materials become more expensive when industry-wide use rises above 40%, and all materials prices rise once global production exceeds 110% of capacity, which happens when overtime is heavy across the industry (Thompson et al., 2026). Your rivals' decisions can therefore raise your costs.
5. Buyer bargaining power: moderate to strong
Buyers are more powerful when they buy in large volumes, can choose between many sellers, or face weak demand relative to supply (Thompson, 2025). In BSG, independent retailers usually stock only two to four brands and choose among all the companies competing for shelf space, while large chain retailers buy private-label footwear on a competitive-bid basis, which makes them powerful price setters. Individual online shoppers have little power one at a time, but they compare prices and S/Q ratings across brands (Thompson et al., 2026).
| Force | Strength | Main evidence |
|---|---|---|
| Rivalry | Strong | Identical starting positions; sales decided by comparison with regional averages on 11 factors |
| New entrants | Very weak | Fixed number of companies; no mergers |
| Substitutes | Weak | Athletic shoes are everyday footwear for many buyers |
| Suppliers | Weak, conditional | Commodity materials from ~250 suppliers; prices rise with heavy use of superior materials or overtime |
| Buyers | Moderate to strong | Retailers carry 2–4 brands; chain stores buy private-label pairs by competitive bid |
Put together, the forces describe an industry with good growth and little pressure from outside, where profitability is decided by rivalry. That is exactly why Thompson (2025) treats the collective strength of the forces as the bottom line: when one force dominates, strategy has to be built around it. For a general walk-through of the five forces with real companies, see our guide to how to do market research.
Driving forces: what is changing in the BSG industry
Driving forces are the main underlying causes of change in an industry's competitive conditions. Thompson (2025) describes three steps: identify the forces, judge whether together they make the industry more or less attractive, and decide what strategy changes they call for. Common drivers include changes in long-term growth, globalisation, new internet capabilities, and shifts in costs or buyer preferences.
In BSG, the main drivers are written into the industry forecasts (Thompson et al., 2026):
- Slowing growth after Year 15. Global demand growth eases from 7–9% to 5–7% a year. Slower growth usually intensifies rivalry, because companies can grow only by taking share from each other.
- Uneven regional growth. Branded demand in the Asia-Pacific and Latin America grows faster than in North America and Europe-Africa, so the most attractive regions for capacity and marketing shift over time.
- The move online. Website sales rise by one percentage point of branded sales every year, from 15% to 25% by Year 20.
- Fast-growing private-label demand, around 10–12% a year, which rewards companies able to bid profitably for chain-store contracts and use spare capacity.
- Trade and currency conditions: tariffs that may rise or fall, and real-world exchange rate movements.
- Your rivals' moves, which change the regional averages every round. Rival behaviour is the most powerful driver of all in a simulation where outcomes are relative.
The point of the exercise is the third step. If growth will slow and online sales will rise, for example, a team might plan capacity so it is not left with expensive idle plants later, and build its online pricing and search advertising before the channel matters most.
Strategic group mapping in BSG: who competes against whom?
A strategic group is a cluster of companies with similar competitive approaches and market positions. A strategic group map plots the rivals on two competitive characteristics that matter in the industry, groups companies that sit close together, and sizes each circle by the group's share of sales (Thompson, 2025). Thompson's guidelines are to choose two variables that are not highly correlated and on which rivals genuinely differ.
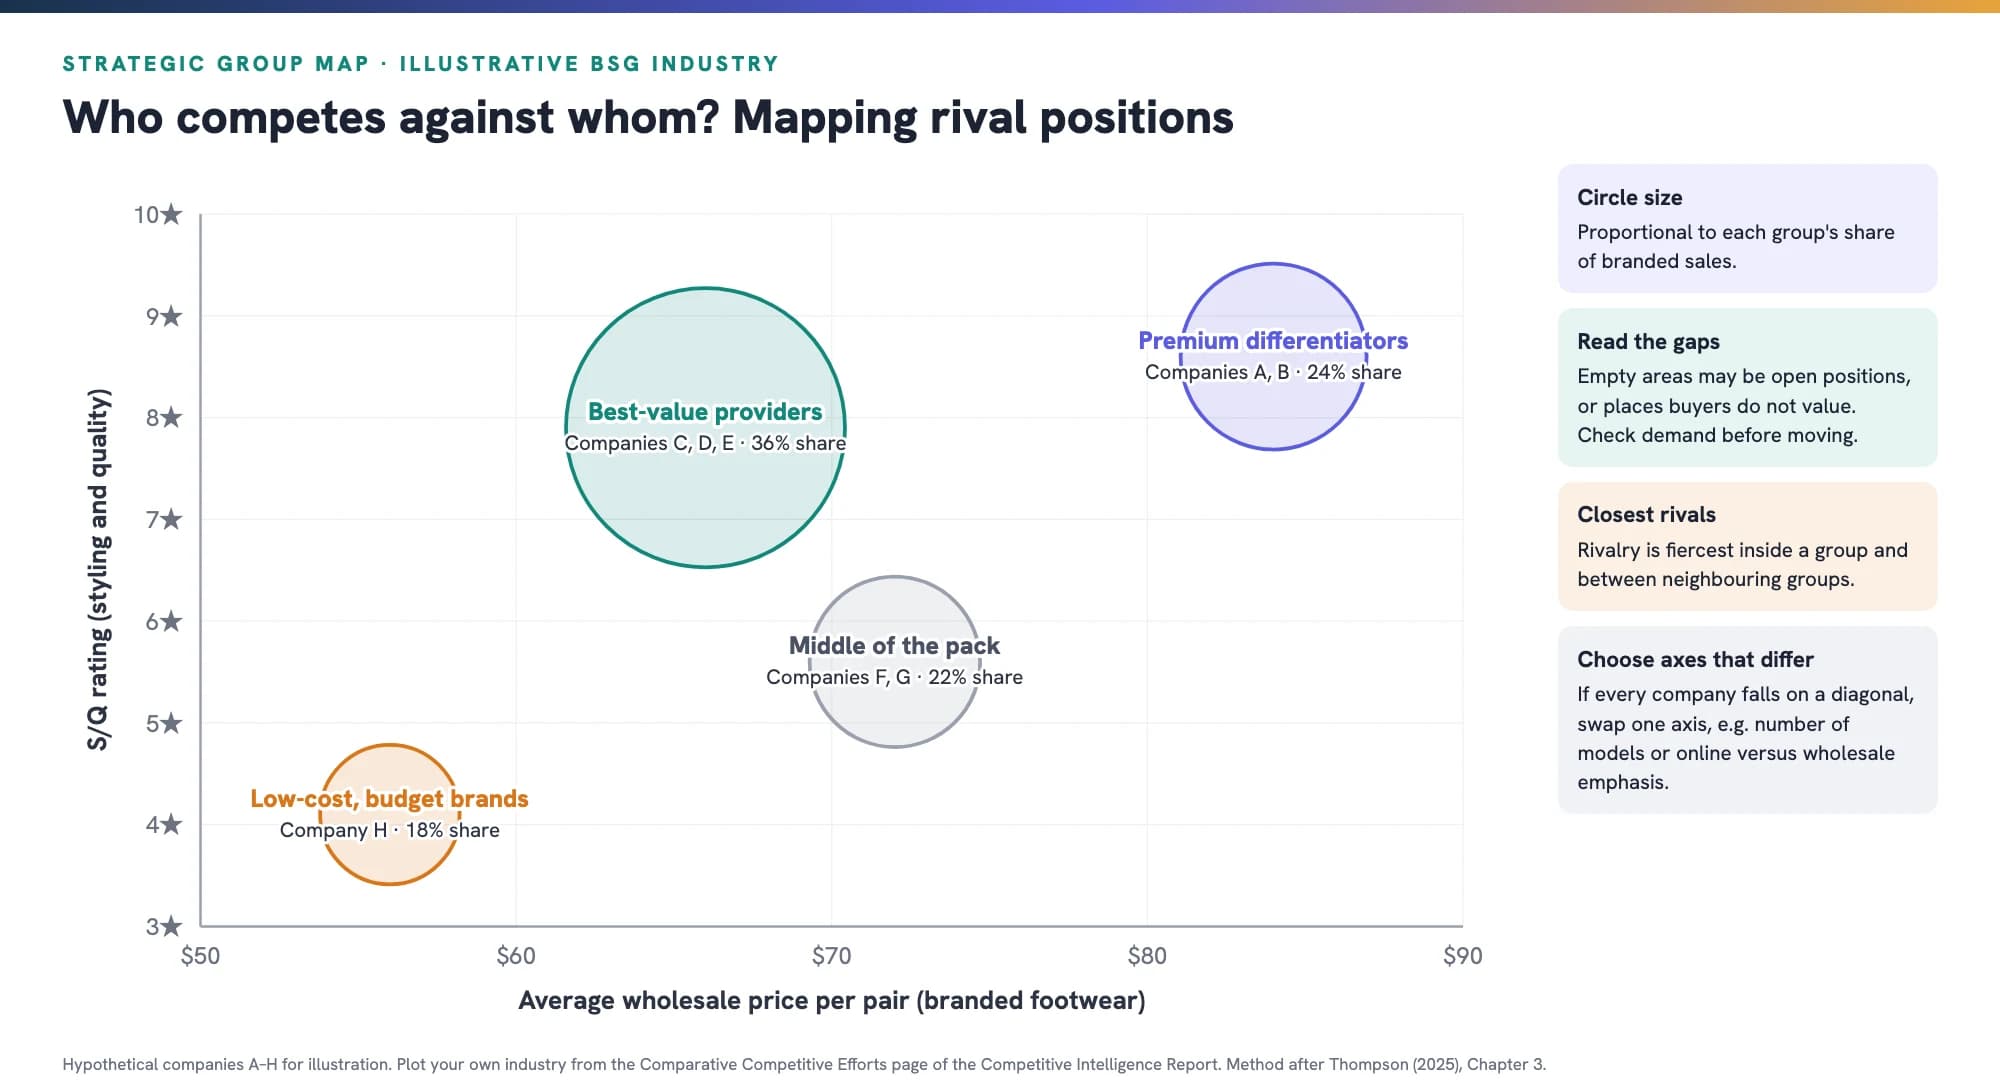
In BSG, average wholesale price and S/Q rating make a good starting pair because the simulation rewards different combinations of them: a premium differentiation strategy pairs high ratings with high prices, while the Player's Guide's "more value for the money" approach offers high-rated footwear at lower prices than comparable brands (Thompson et al., 2026). If your industry's companies all fall along a diagonal, swap one axis for the number of models offered, the share of sales made online, or the regions each company emphasises.
A map shows three things. Your closest rivals are the companies in your group and the neighbouring groups. Some positions are more attractive than others, depending on demand and how crowded they are. And the map shows where a company that is struggling might move next (Thompson, 2025).
Predicting rivals' next moves with the Competitive Intelligence Report
Thompson (2025) compares competitor analysis to scouting the opposition in sports: a company that does not anticipate rivals' moves is caught off guard by them. Rivals that are performing well tend to keep their strategy with small adjustments; rivals that are struggling are very likely to change prices, product appeal or position; and ambitious rivals are the most likely to launch new offensives.
The Player's Guide calls the Competitive Intelligence Report the most dependable information for competing successfully, and recommends reviewing it, together with the Footwear Industry Report, before making any decisions (Thompson et al., 2026). It has three parts:
- Comparative Competitive Efforts: every company's effort on each competitive factor, with unit sales and market share, region by region.
- Regional Average Competitive Efforts: the all-company averages in each region for every year so far. Because sales depend on beating these averages, they are your benchmark.
- Time Series Competitive Efforts: one rival's moves over time, so you can see its direction of travel.
Use them to answer Thompson's (2025) questions for each important rival: Is its strategy working? Is it gaining or losing ground? Which rivals badly need more sales, and what are they most likely to do: cut prices, add models, expand retailer networks, push online sales or raise advertising? Then plan your decisions on the assumption that the regional averages will move, not stay where they were last year.
Key success factors in the Business Strategy Game
Key success factors (KSFs) are the few strategy elements, product attributes, capabilities and market achievements that most separate strong competitors from weak ones (Thompson, 2025). Thompson suggests finding them with three questions: on what basis do buyers choose between brands; what resources and capabilities does the competitive situation demand; and which shortcomings would almost certainly put a company at a disadvantage. There are rarely more than five KSFs, and two or three usually matter most.
For BSG, the Player's Guide answers the first question directly: buyers weigh the 11 competitive factors (Thompson et al., 2026). From the industry analysis above, the likely candidates are:
- S/Q rating relative to price. Consumers know the S/Q ratings and use them to choose brands, so value for money is central.
- Cost per pair delivered, including production, materials, tariffs, shipping and exchange rates. It decides whether a company can price competitively and still earn the profits the board expects.
- Brand reach and image: retailer network and support, advertising and celebrity endorsements in the regions you emphasise.
- Disciplined capacity and inventory management. Unsold branded pairs lose 0.3 S/Q stars when carried into the next year, and idle capacity raises costs.
Thompson's (2025) rule for using KSFs is the most useful part: a strategy should match rivals on every KSF and aim to be clearly better on one or two. Being average on all of them tends to produce average results; falling short on any one is a lasting handicap. Treat this list as a hypothesis to test in your own industry, since the factors that matter most depend on what your rivals do.
Is the industry outlook good for profitability?
The last question pulls the analysis together: is the industry likely to offer good profits, given macro-environmental conditions, growth potential, the expected strength of the competitive forces and the effects of the driving forces (Thompson, 2025)?
For BSG, the answer is a conditional yes. Demand grows strongly for the first five years and steadily after that; most outside forces are weak, and the board's targets assume rising earnings, return on equity, stock price, credit rating and image rating every year (Thompson et al., 2026). But because rivalry decides who captures that growth, the industry is attractive mainly for companies that outcompete their rivals on the key success factors while keeping costs under control.
A round-by-round checklist for BSG industry analysis
- Read the scoreboard and benchmarks in the Footwear Industry Report: where did your company rank, and are any of your costs out of line with rivals?
- Update the five forces. Has rivalry intensified in any region? Are materials prices moving because of industry-wide superior-materials use or overtime?
- Check the driving forces: the demand forecasts for the next three years, exchange rate changes and tariff conditions.
- Redraw your strategic group map from the Comparative Competitive Efforts page and note who moved.
- Predict each key rival's next move, especially struggling or ambitious companies.
- Confirm your KSFs and the one or two on which you intend to beat the regional averages.
- Only then enter decisions, and record the reasoning so your team can learn from the next set of results.
For how this analysis feeds into strategy choices, see how to craft a strategy that beats your rivals in BSG, our BSG Year 11 strategy guide, and our guide to vision, mission and objectives in BSG. To analyse your own company's resources, costs and competitive strength, continue with our guide to BSG internal analysis: SWOT, VRIO and value chain.
Common mistakes in BSG industry analysis
- Copying advice from past industries. The Player's Guide warns that tips from other classes reflect different rivals and are very unlikely to fit yours (Thompson et al., 2026). Your own Competitive Intelligence Report is the evidence that counts.
- Treating the analysis as a one-off. Rivals' moves change the competitive landscape every round.
- Listing every factor as a key success factor, which defeats the purpose of focusing on the few that matter.
- Ignoring regional differences in growth, rivalry, tariffs and exchange rates.
- Chasing low wages without counting productivity, tariffs, shipping and currency effects.
- Forgetting that your industry's averages move. Matching last year's regional average usually leaves you behind this year.
Getting help with the Business Strategy Game
If you would like a strategy specialist to talk through your industry analysis, your Competitive Intelligence Report or your team's strategic options, see our Business Strategy Game coaching. We explain the reasoning so your team can make its own decisions each round, in line with your course's rules.
Frequently asked questions
How do you do a five forces analysis for the Business Strategy Game?
Rate each force for the athletic footwear industry: rivalry is strong because 4–12 identical companies compete on 11 factors; new entrants are very weak because the number of companies is fixed; substitutes are weak; supplier power is weak but rises with heavy superior-materials use or overtime; and buyer power is moderate to strong, especially in private-label bidding.
What is PESTEL analysis in BSG?
A scan of the macro-environment: political (import tariffs), economic (exchange rates and demand growth), sociocultural (the shift to online buying), technological (mature manufacturing), environmental (social responsibility in the image rating) and legal (compliance, no mergers).
What are the key success factors in the Business Strategy Game?
Usually S/Q rating relative to price, cost per pair delivered, brand reach and image through retailers, advertising and endorsements, and disciplined capacity and inventory management. The most important ones depend on what your rivals do, so test them against your Competitive Intelligence Report.
What is a strategic group map and how do I make one for BSG?
A chart that plots rivals on two competitive characteristics, groups those close together and sizes each circle by market share. In BSG, wholesale price against S/Q rating is a useful start; switch an axis if all companies fall on a diagonal.
What are driving forces in industry analysis?
The main underlying causes of change in an industry. In BSG they include slowing demand growth after Year 15, faster growth in Asia-Pacific and Latin America, rising online sales, growing private-label demand, tariffs, exchange rates and rivals' moves.
Which BSG report is most useful for analysing competitors?
The Competitive Intelligence Report, especially the Comparative Competitive Efforts and Regional Average Competitive Efforts pages, read alongside the benchmarking data in the Footwear Industry Report.
Is there a winning strategy for the Business Strategy Game?
No single strategy is guaranteed to win, because results depend on how your efforts compare with your rivals'. The Player's Guide states that the simulation has no built-in bias toward any strategy, which is why careful industry analysis each round matters.
Sources
- Thompson AA. Strategy: Core Concepts and Analytical Approaches. 8th ed. (2025-2026). McGraw Hill; 2025. Chapter 3: Evaluating a company's external environment
- Thompson AA, Stappenbeck GJ, Reidenbach MA. The Business Strategy Game Player's Guide. 2026 ed. GLO-BUS Software; 2026
- Porter ME. The five competitive forces that shape strategy. Harvard Business Review 2008;86(1):78-93
- Velez A, Alonso RK. Business simulation games for the development of decision making: systematic review. Educ Sci 2025;15(2):168

Michael has 6 years of experience in health research, nursing, public health, the social sciences, and qualitative evidence synthesis. He leads or supports projects that organize and interpret qualitative findings while preserving the context of the original studies. Areas of expertise Qualitative evidence…