
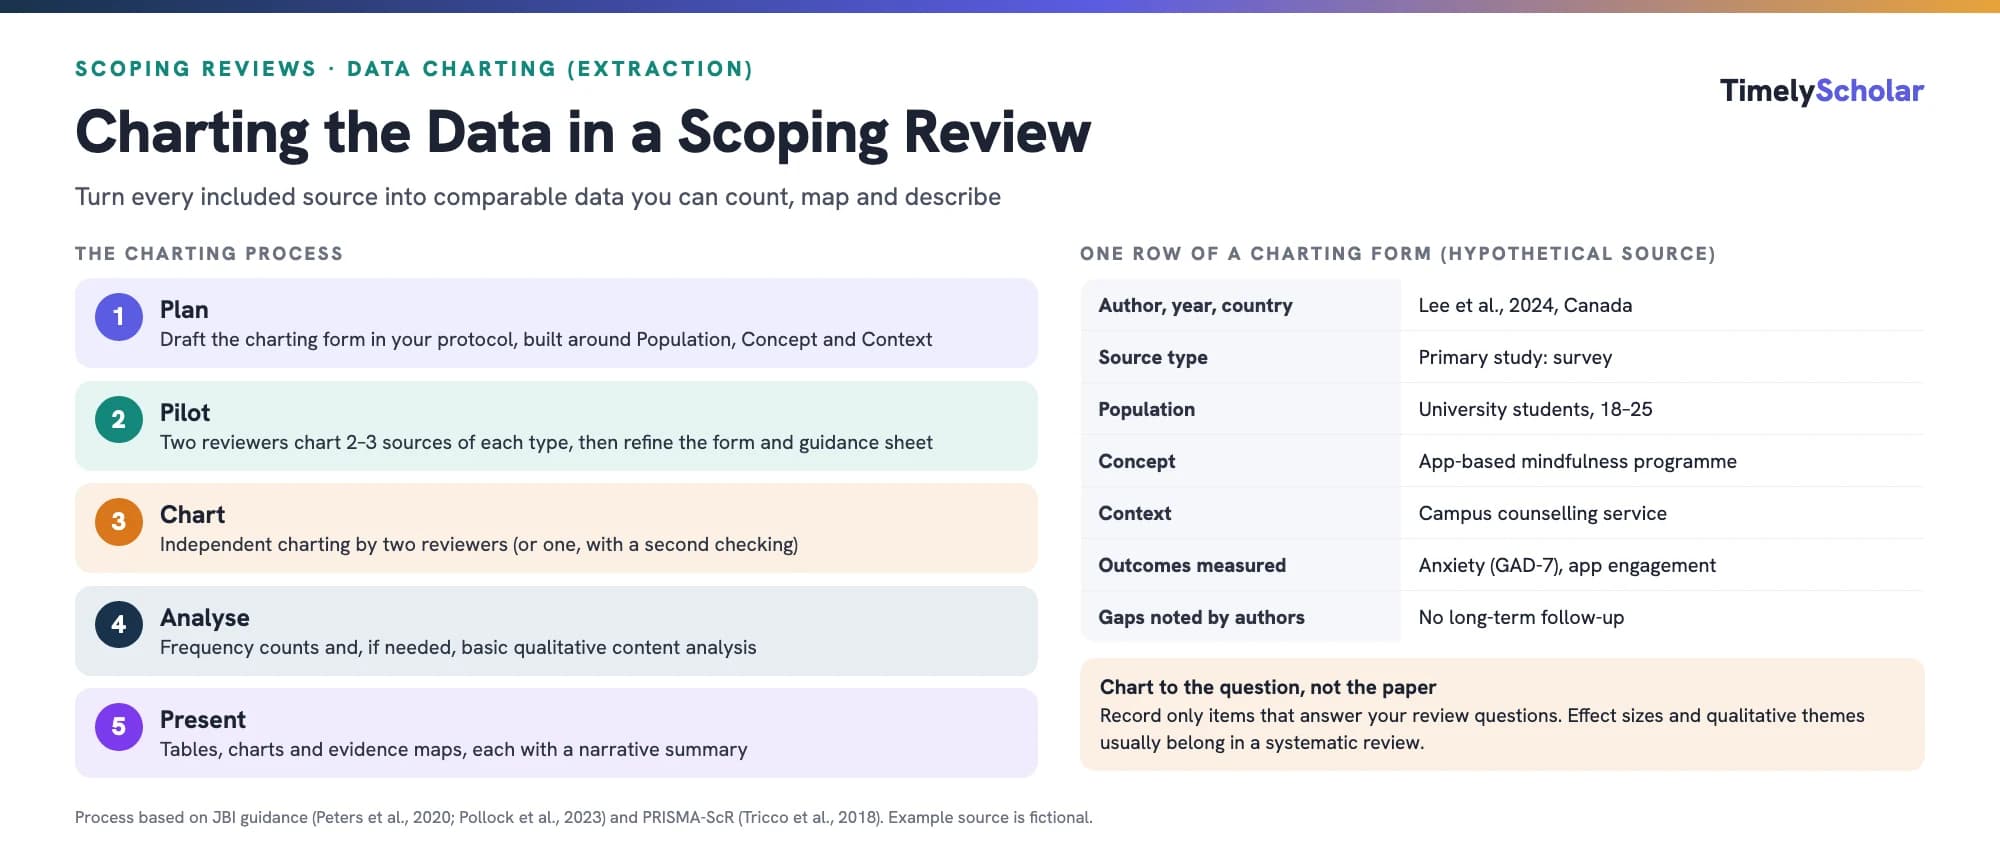
Data charting is the scoping review stage where you record the same set of details from every included source in a standardised form, so the evidence can be counted, mapped and described. JBI now calls it data extraction (Pollock et al., 2023). Build the charting form from your Population, Concept and Context (PCC): typically author, year, country, source type, aims, population, concept details, setting, methods and the findings relevant to your question. Pilot it on two or three sources of each type, have two reviewers chart independently (or one charts and a second checks), and record any changes as protocol deviations. Analyse the charted data with frequency counts and, where needed, basic qualitative content analysis, then present the results in tables, charts or evidence maps with a narrative summary, reported against PRISMA-ScR.
Working on a scoping review? Our specialists follow JBI methods and PRISMA-ScR. Get a free quote →
What is data charting in a scoping review?
A scoping review systematically identifies and maps the evidence on a topic, often across many kinds of sources, to show what exists, how it has been studied and where the gaps are, rather than to judge whether something works (Peters et al., 2020). Charting the data is how that map gets built. In Arksey and O'Malley's (2005) framework, this is the fifth stage, after identifying the question, searching, and selecting sources: you review each included source and record the same set of details in a structured form.
The terminology varies. Arksey and O'Malley (2005), Levac et al. (2010), and the PRISMA-ScR reporting checklist (Tricco et al., 2018) call the stage data charting. Current JBI guidance uses data extraction for consistency with other evidence syntheses, while noting that scoping reviews extract at a higher, more descriptive level than systematic reviews do (Pollock et al., 2023). Either term is acceptable; state which framework you follow and use its language consistently.
New to scoping reviews? If you are new to scoping reviews, start with our step-by-step guide to how to do a scoping review, and check that a scoping review is the right design with our comparison of systematic reviews, meta-analyses and scoping reviews.
Data charting vs data extraction in a systematic review
Charting looks similar to systematic review data extraction, but its purpose differs, which changes what you record.
How scoping review charting differs from systematic review extraction
| Scoping review charting | Systematic review extraction | |
|---|---|---|
| Purpose | Map what evidence exists and how it was produced | Answer a focused question about effects, accuracy or experiences |
| Typical items | Source characteristics, populations, concepts, contexts, methods, outcomes measured | Outcome data such as means, events, effect sizes or qualitative findings |
| Where in the source | Any section: introduction, methods, results, discussion | Mainly methods and results |
| Quality appraisal | Not usually done | Required (risk of bias) |
| Analysis | Frequency counts and basic qualitative content analysis | Meta-analysis, meta-synthesis or structured narrative synthesis |
| Form | Iterative; may be updated as charting proceeds | Fixed in advance |
Pollock et al. (2023) urge caution about charting the results of included studies, such as effect sizes or qualitative themes. Because scoping reviews do not appraise study quality or pool results, presenting those findings invites readers to draw conclusions about effectiveness that the review cannot support. If your question needs results like these, a systematic review is usually the better design.
What to chart: building your data charting form
Chart only what helps answer your review questions (Pollock et al., 2023). The simplest way to decide is to start from the PCC elements that define your eligibility criteria and add the items your objectives require: methods if you are mapping how a topic has been studied, definitions if you are clarifying a concept, intervention details if you are mapping what has been tried.
Scoping review data charting template
The fields below cover most scoping reviews. Copy them into a spreadsheet, one row per source and one column per field, then add the items specific to your questions. The example values come from a fictional review of digital mental health tools for university students.
Data charting form template with example entries
| Field | What to record | Example entry |
|---|---|---|
| Citation | First author, year, title | Lee et al., 2024 |
| Country | Where the work was done (or the authors' country for non-empirical sources) | Canada |
| Source type | Primary study (and design), review, guideline, policy, report, thesis, commentary | Primary study: cross-sectional survey |
| Aim | The source's stated aim or purpose | To describe use of mental health apps among students |
| Population | Who the source is about, with the characteristics your question needs | University students aged 18–25 (n = 412) |
| Concept | The details of the concept you are mapping | App-based mindfulness programme, 8 weeks |
| Context | Setting, sector or circumstances | Campus counselling service |
| Methods | Data collection and analysis, if relevant to your questions | Online survey; descriptive statistics |
| Outcomes or measures | What was measured, and how (not the results, unless justified) | Anxiety (GAD-7); engagement (logins per week) |
| Key findings relevant to the question | Brief, descriptive, tied to your review questions | Engagement fell after week 3 |
| Gaps and recommendations | Gaps or future research the authors identify | No long-term follow-up |
| Notes | Anything unclear, and whether the authors were contacted | Sample overlaps with Lee 2023 |
Alongside the form, write a short guidance sheet that defines every field, gives examples and says what to enter when information is missing (for example, "not reported"). Pollock et al. (2023) recommend this so that every reviewer charts in the same way. You can build both quickly with our free data extraction form builder.
Chart against a framework: Frameworks make charting precise. If you are mapping how interventions are described, for example, chart each item of a reporting checklist as fully, partly or not reported for every source, which turns a vague impression into countable data (Pollock et al., 2023).
How to chart the data: step by step
Plan charting in your protocol. Describe the charting approach and include a draft charting form that goes beyond the PCC headings. JBI's protocol guidance asks for a planned, topic-specific form and a description of how the data will be analysed and presented for each review question (Peters et al., 2022).
Write the guidance sheet that defines each field.
Pilot the form. Each reviewer charts two or three sources of every type you have included (primary studies, reviews, guidelines and so on), then the team compares results. Ask whether anything is missing, redundant or unclear, and how long each source took, so you can plan the remaining time (Pollock et al., 2023).
Agree the final form in a team meeting and update the guidance sheet.
Chart independently. Best practice is two reviewers charting every source independently and resolving differences by discussion. If that is not feasible, one reviewer can chart while a second checks all or a sample of the entries (Pollock et al., 2023). Levac et al. (2010) also recommend that the team chart iteratively and meet early to discuss uncertainties.
Contact authors when key information is missing or unclear, and note it.
Update the form if you need to. Charting is iterative in a scoping review: you may discover useful items you did not anticipate. Add them, chart them for all sources, and report the change and the reason as a deviation from the protocol (Pollock et al., 2023).
Practical guides for nursing and midwifery teams stress the same points: rigour and transparency at the charting stage are what separate a credible scoping review from a loosely organised literature review (Pollock et al., 2021).
Analysing charted data: counts and basic qualitative content analysis
Scoping reviews are descriptive, so the analysis should be too. JBI guidance recommends frequency counts, tables and figures and, where appropriate, basic qualitative content analysis (Aromataris et al., 2024; Pollock et al., 2023). Plan the analysis for each review question in your protocol, in more detail than "descriptive statistics and a narrative summary" (Peters et al., 2022).
Frequency counts
Most charted items become counts and percentages: how many sources come from each country or year, how many used each design, how many measured each outcome. These need only a spreadsheet.
Basic qualitative content analysis
When a question asks you to identify characteristics, factors or definitions- for example, barriers and facilitators, or how a concept is defined, you may need to group text into categories. Pollock et al. (2023) describe basic qualitative content analysis in three phases: preparation (decide in the protocol whether you need it and whether to work inductively or deductively), organising (code and categorise the charted text), and reporting. Two approaches are possible:
Inductive: read the charted text, code it openly, then build a coding framework of categories with definitions, which two reviewers apply and reconcile. Useful when little is known or when the review aims to inform a conceptual framework.
Deductive: chart text directly into categories from an existing framework chosen in advance, noting anything that does not fit. If the framework turns out to fit poorly, you can switch to an inductive approach and report the change.
What a scoping review should not do is reinterpret the evidence with thematic synthesis, meta-aggregation or meta-analysis. Those methods answer questions about experiences or effectiveness and belong in systematic reviews (Pollock et al., 2023). This is different from reflexive thematic analysis of your own interview data.
Watch for double counting: If you include reviews as well as primary studies, the same study can be counted twice: once on its own and again inside a review. State how you handled overlap and which primary studies each included review contains (Pollock et al., 2023).
Presenting the results: tables, charts and evidence maps
Results are usually presented as a table of source characteristics plus figures that summarise the main patterns, each accompanied by a narrative that explains what the figure shows (Pollock et al., 2023). Large tables can go in a supplementary file, with the main text reporting summaries.
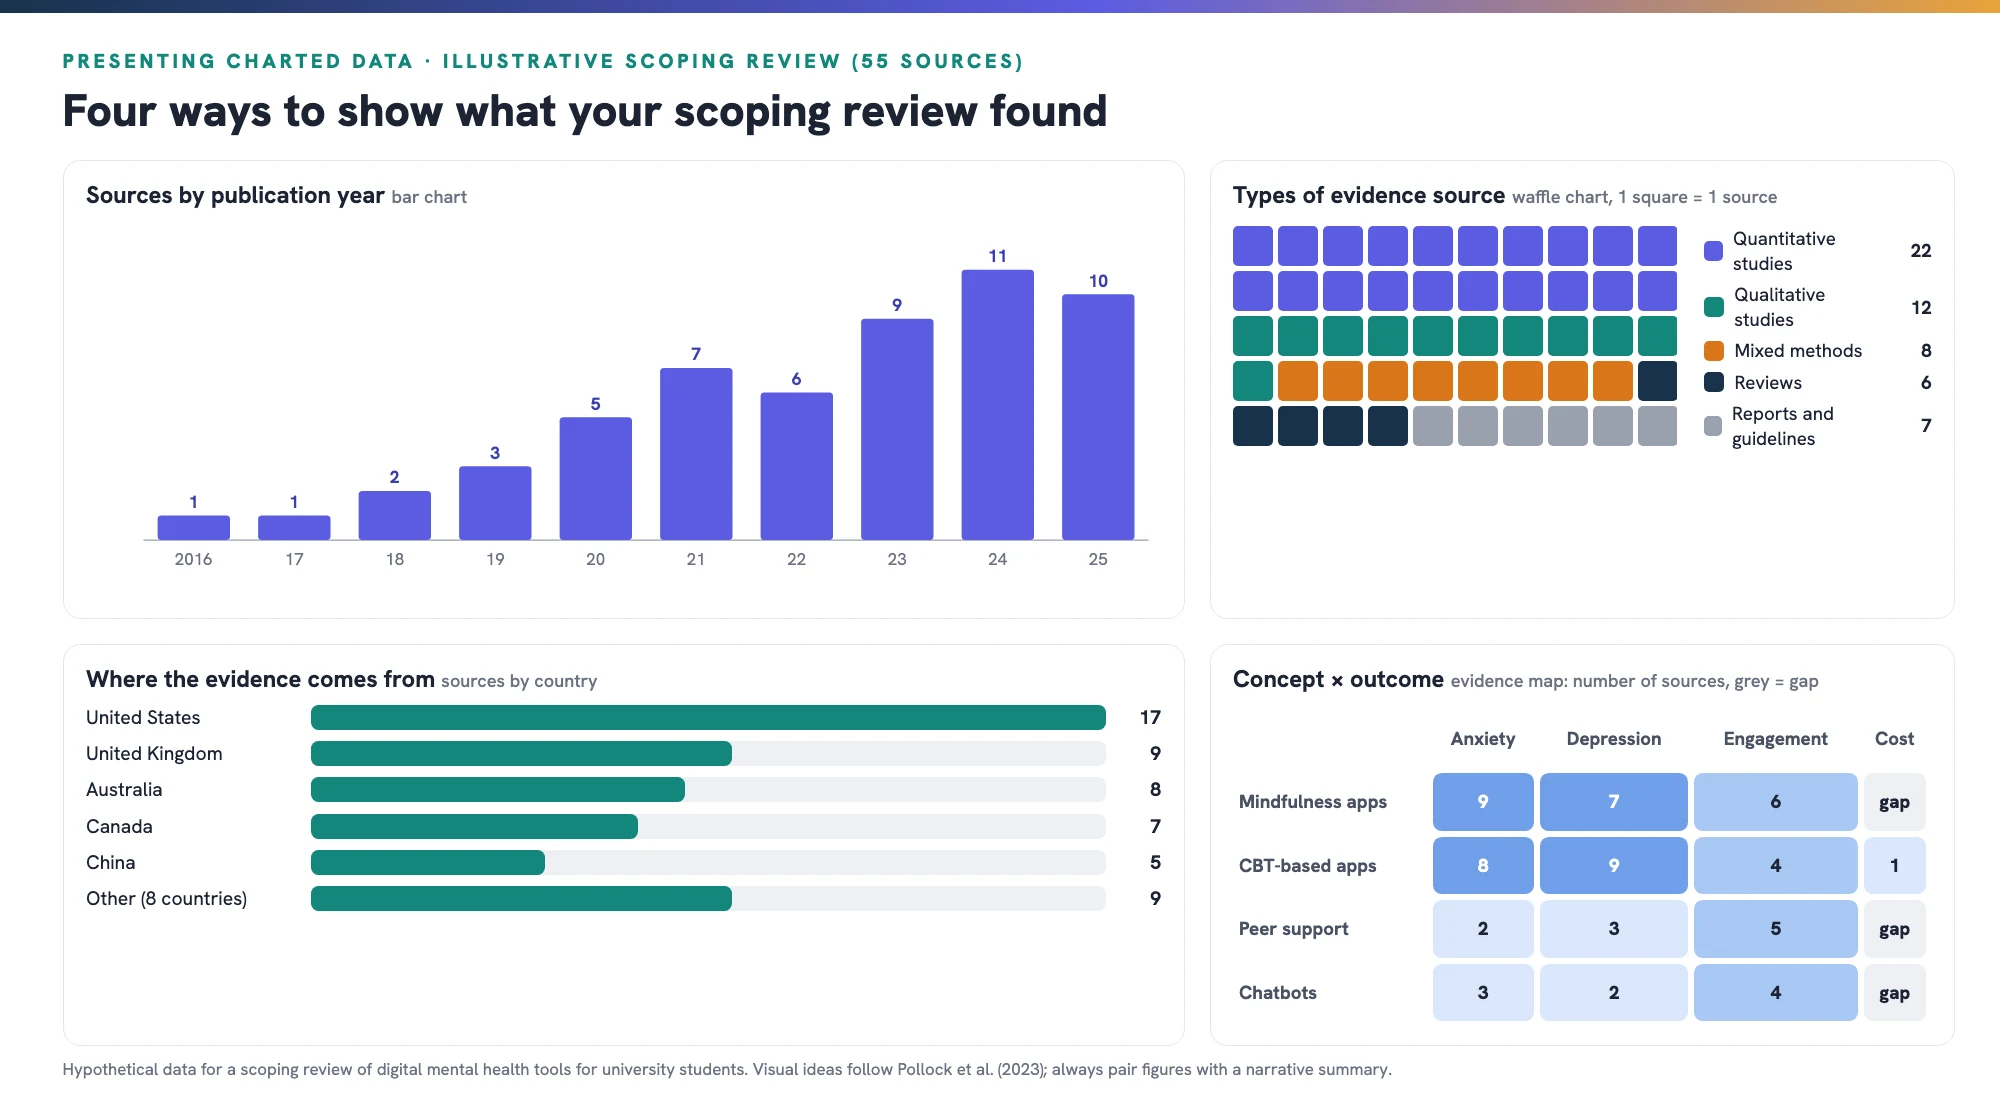
Four common ways to present charted data, using hypothetical results from 55 sources.
Characteristics table: one row per source with citation, country, design, population and concept. Often the first table in the results.
Bar or line charts: sources by year, country or design.
Waffle or pie charts: the mix of source types.
Geographic maps or heat maps showing where evidence was produced.
Evidence and gap maps: a grid of, for example, interventions by outcomes, with the number of sources in each cell, which shows at a glance where evidence clusters and where it is missing (White et al., 2020). Build one from your charted data with our evidence gap map generator.
Writing the results section
A clear scoping review results section usually follows this order: the PRISMA-ScR flow diagram and number of sources included; the characteristics of the sources (year, country, design); then one subsection for each review question, each with its table or figure and a descriptive summary. Describe what the evidence covers and where it is thin, and avoid language that implies effectiveness, such as "the intervention improved anxiety".
Reporting data charting with PRISMA-ScR
PRISMA-ScR is the reporting guideline for scoping reviews (Tricco et al., 2018). Several items relate directly to charting: item 10 (the data charting process), item 11 (the data items charted), item 14 (how the charted data were summarised) and items 17, 18, 20 and 21, which cover the sources and their results; Pollock et al. (2023) list these as the items to check when writing up charting, analysis and presentation. Include the completed checklist, with page numbers, as a supplementary file, and our free PRISMA-ScR checklist can generate it.
Example methods paragraph (illustrative)
Data were charted using a standardised form developed from the review's population, concept and context and piloted by two reviewers on three sources of each evidence type. Two reviewers then charted all sources independently, resolving discrepancies by discussion with a third reviewer. Charted items included country, source type, population characteristics, intervention details, setting and outcomes measured. Two items (delivery format and cost) were added during charting and charted for all sources, a deviation from the protocol. Data were summarised as frequencies and percentages and, for barriers and facilitators, through deductive basic qualitative content analysis.
Software for charting scoping review data
Common tools for charting, analysing and presenting scoping review data
| Tool | Good for |
|---|---|
| Excel or Google Sheets | The charting form itself, filters and frequency counts; Google Sheets supports real-time team editing |
| Covidence or similar review software | Screening plus customisable extraction forms and dual extraction with consensus |
| NVivo | Coding text for basic qualitative content analysis |
| Power BI, Tableau or EPPI-Mapper | Interactive charts and evidence maps |
Pollock et al. (2023) list spreadsheets, qualitative analysis software and visualisation tools as suitable options; the best choice is the one your team already knows. Whatever you use, keep the charting file versioned so the final dataset matches what you report.
Common data charting mistakes
Charting everything. Every extra field costs time across every source; chart to your questions.
A form with only the PCC headings. Protocols need a detailed, topic-specific form (Peters et al., 2022).
Skipping the pilot, which leads to inconsistent entries that are hard to count.
Charting effect sizes and drawing conclusions about effectiveness without appraisal or synthesis.
Using thematic synthesis or other interpretive methods instead of descriptive counts and basic content analysis.
Undocumented changes to the form. Report additions as protocol deviations.
Double counting studies that appear both individually and inside included reviews.
Figures without a narrative, or a narrative that goes beyond what was charted.
Khalil et al. (2021) note that many of the difficulties scoping reviewers face, from protocol to publication, come from unclear methods; a well-documented charting stage solves several of them at once.
Getting help with your scoping review
If you would like experienced reviewers to help design your charting form, act as a second charting reviewer, analyse the charted data or build your evidence map, see our scoping review service. We follow JBI methods and report to PRISMA-ScR, and you keep ownership of your question and conclusions.
Frequently asked questions
What is data charting in a scoping review?
The stage where reviewers record the same set of details from every included source in a standardised form, so the evidence can be counted, mapped and described. JBI now calls it data extraction.
What should a scoping review data charting form include?
Citation, country, source type, aims, population, concept details, context or setting, methods and outcomes measured where relevant, findings related to the review question, gaps identified, and notes. Build it from your population, concept and context, and add items your questions require.
What is the difference between data charting and data extraction?
Arksey and O'Malley and PRISMA-ScR use the term data charting; JBI uses data extraction. Either way, scoping reviews record descriptive information to map the evidence rather than outcome data for pooling.
How many reviewers should chart the data in a scoping review?
Best practice is two reviewers charting independently. If that is not possible, one reviewer can chart while a second checks all or a sample of the entries.
Can you do thematic analysis in a scoping review?
Interpretive synthesis such as thematic synthesis is not recommended. JBI guidance recommends frequency counts and, where needed, basic qualitative content analysis, which groups charted text into descriptive categories.
How do you present the results of a scoping review?
With a table of source characteristics, figures such as bar charts, waffle charts, maps or evidence and gap maps, and a narrative summary for each review question.
What is a scoping review in research?
A type of evidence synthesis that systematically maps the evidence on a topic, often across many kinds of source, to show what exists, how it has been studied and where the gaps are, rather than whether an intervention works.
Is there a scoping review data extraction template in Excel?
Yes. Use one row per source and one column per charting field; the template in this guide lists the standard fields, and our free data extraction form builder creates a ready-to-use form.
Sources
- Pollock D, Peters MDJ, Khalil H, et al. Recommendations for the extraction, analysis, and presentation of results in scoping reviews. JBI Evid Synth 2023;21(3):520-532
- Peters MDJ, Marnie C, Tricco AC, et al. Updated methodological guidance for the conduct of scoping reviews. JBI Evid Synth 2020;18:2119-2126
- Peters MDJ, Godfrey C, McInerney P, et al. Best practice guidance and reporting items for the development of scoping review protocols. JBI Evid Synth 2022;20(4):953-968
- Aromataris E, Lockwood C, Porritt K, Pilla B, Jordan Z, editors. JBI Manual for Evidence Synthesis. JBI; 2024
- Tricco AC, Lillie E, Zarin W, et al. PRISMA Extension for Scoping Reviews (PRISMA-ScR): checklist and explanation. Ann Intern Med 2018;169:467-473
- Pollock D, Davies EL, Peters MDJ, et al. Undertaking a scoping review: a practical guide for nursing and midwifery students, clinicians, researchers, and academics. J Adv Nurs 2021;77(4):2102-2113
- Khalil H, Peters MDJ, Tricco AC, et al. Conducting high quality scoping reviews: challenges and solutions. J Clin Epidemiol 2021;130:156-160
- Arksey H, O'Malley L. Scoping studies: towards a methodological framework. Int J Soc Res Methodol 2005;8:19-32
- Levac D, Colquhoun H, O'Brien KK. Scoping studies: advancing the methodology. Implement Sci 2010;5:69
- White H, Albers B, Gaarder M, et al. Guidance for producing a Campbell evidence and gap map. Campbell Syst Rev 2020;16:e1125

James has 7 years of experience in epidemiology, clinical research, public health, and evidence-based healthcare. He supports researchers and healthcare professionals through the whole evidence synthesis process, from refining a question and planning a protocol to reporting the results. Areas of expertise Systematic…