
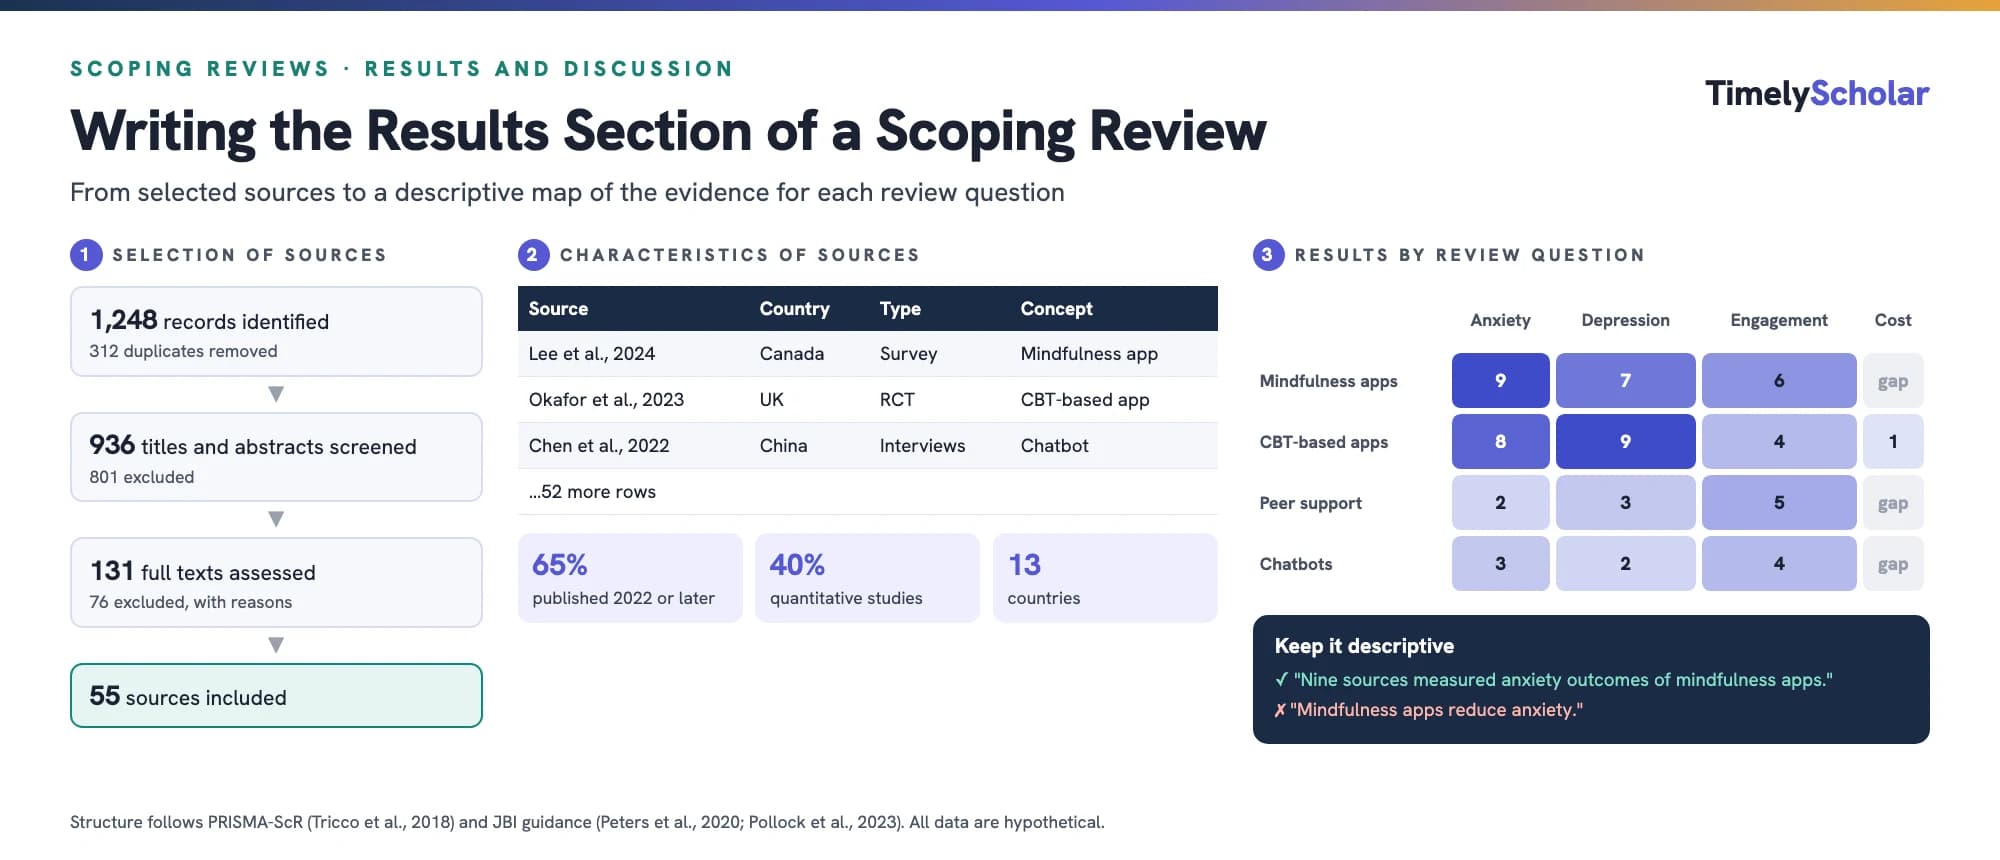
The results section of a scoping review reports two things: how the sources of evidence were selected, and what the charted evidence shows for each review question [1]. Start with the numbers screened, assessed and included, with reasons for exclusion, ideally in a PRISMA flow diagram. Then present the characteristics of the included sources in a table with citations. Finally, summarize the charted data for each question with frequency counts, tables and figures, such as charts by year, design or country and an evidence-gap matrix, each with a short narrative [2,3]. Keep the language descriptive: report what evidence exists, where and how it was studied, and where it is missing. Do not report pooled effects or claims about what works. The discussion then summarizes the main findings and gaps, the limitations of the review process, and the implications of the findings for research, practice or policy.
Working on a scoping review? Our specialists follow JBI methods and PRISMA-ScR. Get a free quote →
What goes in the results section of a scoping review?
Charting turns every included source into comparable data; the results section is where that data answers your review questions. If you have not charted your sources yet, start with our guide to data charting in a scoping review, which uses the same example review as this article.
JBI guidance describes the results of a scoping review as two broad parts: the results of the search and selection process, including a PRISMA flow diagram, and the key information relevant to the review's objectives or questions [1]. The PRISMA-ScR reporting guideline breaks these down into five results items [2]:
PRISMA-ScR results items and how to report them
| Item | What to report | Usual format |
|---|---|---|
| 14. Selection of sources of evidence | Numbers screened, assessed for eligibility and included, with reasons for exclusion at each stage | Flow diagram plus one or two sentences |
| 15. Characteristics of sources of evidence | The charted characteristics of each source, with its citation | Characteristics table (often a supplementary file) |
| 16. Critical appraisal within sources (optional) | Appraisal results, only if appraisal was done | Table or short paragraph |
| 17. Results of individual sources of evidence | The charted data relevant to the review questions, for each source | Detailed table, usually supplementary |
| 18. Synthesis of results | A summary of the charted results for each review question or objective | Frequency tables, figures and narrative |
Arksey and O'Malley's framework calls this stage collating, summarizing and reporting the results [4]. Levac et al. split it into three distinct steps: analyzing the data (a descriptive numerical summary plus a qualitative description), reporting the results in relation to the review's purpose, and considering what the findings mean, including their implications for research, practice and policy [5]. The first two steps belong in the results section; the third belongs in the discussion.
Plan it early: Plan the presentation of each review question in your protocol, as JBI recommends [1], and refine it once you know what the included evidence looks like. Our guide to doing a scoping review covers the protocol stage.
Part 1: Report how sources were selected
Open the results with the flow of sources through the review (PRISMA-ScR item 14) [2]. Give the number of records identified, duplicates removed, records screened, full texts assessed, and sources included, with the reasons full texts were excluded. A flow diagram makes this easy to follow, yet in a review of 494 published scoping reviews, fewer than half (47%) used one [6].
Example: selection of sources (hypothetical review)
"The searches identified 1,248 records. After 312 duplicates were removed, 936 titles and abstracts were screened, and 801 were excluded. Of the 135 full texts sought, 4 could not be retrieved; 131 were assessed, and 76 were excluded (population not university students, n = 31; not a digital mental health tool, n = 25; source type outside the inclusion criteria, n = 12; conference abstract with insufficient detail, n = 8). Fifty-five sources were included (Figure 1).
Make sure the numbers add up at every stage, and that the final count matches the number of rows in your characteristics table. Our free PRISMA flow diagram generator calculates the totals and draws the diagram.
Part 2: Describe the characteristics of the included sources
PRISMA-ScR item 15 asks you to present the characteristics you charted for each source, with its citation [2]. This is usually the first table in a scoping review, and it is the table most people mean when they search for a "scoping review table example." Its columns mirror your charting form, so it builds directly on the population, concept, and context you charted.
Table 1. Characteristics of included sources (first rows of a hypothetical example)
| Source | Country | Source type | Population | Concept (tool) | Context | Outcomes measured |
|---|---|---|---|---|---|---|
| Lee et al., 2024 | Canada | Primary study: survey | University students, 18–25 | App-based mindfulness program, 8 weeks | Campus counseling service | Anxiety (GAD-7); app engagement |
| Okafor et al., 2023 | United Kingdom | Primary study: RCT | First-year undergraduates | CBT-based self-help app | Online, university-wide | Depression (PHQ-9); anxiety |
| Chen et al., 2022 | China | Qualitative study: interviews | Postgraduate students | Mental health chatbot | University health center | Acceptability; engagement |
| Student Wellbeing Network, 2025 | Australia | Report | Students at 12 universities | Peer support platform | National program | Uptake; cost |
With many included sources, a full characteristics table quickly becomes too large for the main text of a journal article [3]. A common solution is to put the full table in a supplementary file and summarize the characteristics in the text with counts and percentages.
Example: summarizing characteristics in the text (hypothetical review)
"The 55 included sources were published between 2016 and 2025; 36 (65%) were published from 2022 onward. Most were quantitative studies (n = 22, 40%), followed by qualitative studies (n = 12, 22%), mixed-methods studies (n = 8, 15%), reports and guidelines (n = 7, 13%), and reviews (n = 6, 11%). Sources came from 13 countries, most often the United States (n = 17, 31%), the United Kingdom (n = 9, 16%) and Australia (n = 8, 15%)."
Critical appraisal is optional in scoping reviews (PRISMA-ScR items 12 and 16) [2]. Most scoping reviews do not appraise their sources, because they are not designed to underpin clinical practice decisions [7]. If you did appraise them, report the results and explain how you used them; do not use appraisal to rank which interventions work.
Part 3: Summarize the charted results for each review question
The core of the results section (PRISMA-ScR items 17 and 18) summarizes the charted data in relation to each review question or objective [2]. Give each question its own subsection, with a table or figure and a narrative. Most scoping reviews analyze charted data with frequency counts and simple descriptive statistics such as percentages, and some use basic qualitative content analysis to group charted text into categories [3]. The detailed source-by-source data for item 17 usually goes in a supplementary table.
Table 2. Number of sources by digital tool and outcome measured (hypothetical example; a source can report more than one outcome)
| Digital tool | Anxiety | Depression | Engagement | Cost |
|---|---|---|---|---|
| Mindfulness apps | 9 | 7 | 6 | 0 (gap) |
| CBT-based apps | 8 | 9 | 4 | 1 |
| Peer support platforms | 2 | 3 | 5 | 0 (gap) |
| Chatbots | 3 | 2 | 4 | 0 (gap) |
Example: narrative for one review question (hypothetical review)
"Mindfulness and CBT-based apps were the most frequently studied tools, and anxiety and depression were the most frequently measured outcomes. Peer support platforms and chatbots were mostly evaluated for engagement. Only one source reported costs, and no source examined the costs of mindfulness apps, peer support platforms or chatbots (Table 2)."
Two cautions apply when you count. First, a source can contribute to several cells, so cell totals can exceed the number of sources; say so in the table note. Second, if you included reviews as well as primary studies, the same study can be counted twice. Pollock et al. recommend avoiding counting the same data more than once and reporting which primary studies were already included in the reviews [3].
For questions about characteristics or definitions, such as barriers and facilitators, present the categories from your content analysis in a table with the number of sources contributing to each, and a short description of each category. Stay descriptive: re-interpreting the evidence through thematic synthesis or meta-aggregation goes beyond a scoping review [3].
Which figures to use for scoping review results
Tables summarize a lot of information, but figures often communicate the overall map more quickly. Pollock et al. give examples ranging from word clouds and honeycomb diagrams to world heat maps, tree graphs, icon arrays, waffle charts, and interactive maps, and stress that every visual needs a supporting narrative [3].
Matching the figure to the question
| What you want to show | Figure that works well |
|---|---|
| Growth of the evidence over time | Bar chart of sources by publication year |
| Mix of source types or designs | Waffle chart or simple bar chart |
| Where the evidence comes from | Map or bar chart by country |
| Which combinations have been studied, and the gaps | Evidence-gap matrix or heat map |
| Categories within a concept | Tree graph or grouped bar chart |
| How often terms or definitions appear | Word cloud, used alongside a table of counts |
An evidence map is a systematic search of a broad field that presents its results in a user-friendly format, often a figure or a searchable database, to identify gaps in knowledge [8]. Evidence maps can be used to present the results of a scoping review [7]. A grid of tools by outcomes, like Table 2 above, is the simplest version, and our free evidence gap map generator turns charted data into one. The charting guide shows four example figures built from the same hypothetical review.
Writing results in descriptive language
The most common mistake in scoping review results is to write as if the review had tested effectiveness. Scoping reviews do not appraise or pool results, so statements about what works risk misleading readers, and counting how many studies found a positive effect (vote counting) is not a valid substitute [3]. If your question needs effect estimates, a systematic review is the better design.
Descriptive versus overreaching results
Descriptive (appropriate): "Nine sources measured anxiety outcomes of mindfulness apps, mostly in single-site studies with follow-up of eight weeks or less."
Overreaching (avoid): "Mindfulness apps reduce anxiety in university students."
Descriptive (appropriate): "No source reported the costs of peer support platforms."
Overreaching (avoid): "Peer support platforms are not cost-effective."
Writing the discussion and conclusions
PRISMA-ScR has three discussion items [2]:
Summary of evidence (item 19): the main results, including an overview of concepts, themes and types of evidence, linked to the review questions and their relevance to key groups.
Limitations (item 20): limitations of the scoping review process, such as search restrictions, languages, gray literature coverage or a single reviewer at any stage.
Conclusions (item 21): a general interpretation in relation to the review questions, with potential implications and next steps.
JBI renamed "implications for practice" as implications of the findings [1], and scoping reviews are not designed to support clinical practice decisions [7]. Frame conclusions as what the evidence map means for future research, practice or policy [5], not as graded recommendations. In the 494 scoping reviews examined by Tricco et al., most used their results to identify evidence gaps (85%) and recommend future research (84%), about half (54%) discussed implications for policy or practice, and 12% recommended a systematic review [6].
Example: conclusions paragraph (hypothetical review)
"Evidence on digital mental health tools for university students has grown rapidly since 2022 but is concentrated in a few high-income countries and on anxiety and depression outcomes. Peer support platforms and chatbots have mainly been evaluated for engagement, and costs are almost never reported. Future studies should include economic outcomes and longer follow-up, and the number of trials of CBT-based apps may now support a systematic review of their effectiveness."
Funding, supplementary files and the PRISMA-ScR checklist
PRISMA-ScR item 22 asks for the funding of both the included sources and the scoping review itself, and the role of the review's funders [2]. Submit the completed PRISMA-ScR checklist with page numbers as a supplementary file, and check the page numbers against the final proofs [3]. Our free PRISMA-ScR checklist can generate it. Typical supplementary files are the full search strategies, the charting form, the full characteristics and results tables, and the list of excluded full texts with reasons.
Common mistakes in scoping review results
No flow diagram, or numbers that do not add up between the diagram, the text, and the tables.
One giant table in the main text instead of a summary plus a supplementary file.
Results not organized by review question, so readers cannot see how each question was answered.
Figures without a narrative, or a narrative that only repeats the table.
Effect sizes, pooled estimates, or vote counting, which imply conclusions a scoping review cannot support.
Double counting primary studies that also appear inside included reviews.
Graded practice recommendations in the conclusions instead of implications of the findings.
Discussing limitations of the included studies but not of the scoping review process itself.
Getting help with your scoping review
If you would like experienced reviewers to check your results tables, build your figures or evidence map, or review your discussion against PRISMA-ScR, see our scoping review service. We follow JBI methods and report to PRISMA-ScR, and you keep ownership of your question and conclusions.
Frequently asked questions
What goes in the results section of a scoping review?
Two parts: how sources were selected (numbers screened, assessed and included, with reasons for exclusion, usually in a PRISMA flow diagram), and the charted findings for each review question, presented in tables and figures with a descriptive narrative.
How do you present the results of a scoping review?
With a table of source characteristics, frequency tables or charts for each review question, and figures such as bar charts, maps or evidence-gap matrices. Every table or figure should have a short narrative explaining what it shows.
What tables should a scoping review include?
Usually a characteristics table (one row per source with its citation, country, source type, population, concept and context), plus summary tables for each review question. Large source-by-source tables often go in a supplementary file.
Should a scoping review include a PRISMA flow diagram?
Yes. PRISMA-ScR item 14 asks for the numbers of sources screened, assessed and included, with reasons for exclusion, ideally in a flow diagram.
Do scoping reviews report effect sizes?
No. Scoping reviews map the evidence rather than pooling results, so they report counts and descriptions, not effect sizes, pooled estimates or vote counts. Questions about effectiveness need a systematic review.
What is the difference between the results and the discussion in a scoping review?
The results describe what the evidence covers. The discussion summarizes the main findings, explains the limitations of the review process and sets out the implications of the findings for research, practice or policy.
Can a scoping review make recommendations for practice?
Scoping reviews are not designed to support clinical practice decisions. JBI uses the term implications of the findings, which usually point to research gaps, future studies or whether a systematic review is warranted.
How long is the results section of a scoping review?
It depends on the number of questions and sources. Keep the main text to summaries, one table or figure per question and short narratives, and move detailed tables to supplementary files.
References
- Peters MDJ, Marnie C, Tricco AC, Pollock D, Munn Z, Alexander L, et al. Updated methodological guidance for the conduct of scoping reviews. JBI Evid Synth. 2020;18(10):2119-26. doi:10.11124/JBIES-20-00167
- Tricco AC, Lillie E, Zarin W, O'Brien KK, Colquhoun H, Levac D, et al. PRISMA Extension for Scoping Reviews (PRISMA-ScR): checklist and explanation. Ann Intern Med. 2018;169(7):467-73. doi:10.7326/M18-0850
- Pollock D, Peters MDJ, Khalil H, McInerney P, Alexander L, Tricco AC, et al. Recommendations for the extraction, analysis, and presentation of results in scoping reviews. JBI Evid Synth. 2023;21(3):520-32. doi:10.11124/JBIES-22-00123
- Arksey H, O'Malley L. Scoping studies: towards a methodological framework. Int J Soc Res Methodol. 2005;8(1):19-32. doi:10.1080/1364557032000119616
- Levac D, Colquhoun H, O'Brien KK. Scoping studies: advancing the methodology. Implement Sci. 2010;5(1):69. doi:10.1186/1748-5908-5-69
- Tricco AC, Lillie E, Zarin W, O'Brien K, Colquhoun H, Kastner M, et al. A scoping review on the conduct and reporting of scoping reviews. BMC Med Res Methodol. 2016;16(1):15. doi:10.1186/s12874-016-0116-4
- Peters MDJ, Marnie C, Colquhoun H, Garritty CM, Hempel S, Horsley T, et al. Scoping reviews: reinforcing and advancing the methodology and application. Syst Rev. 2021;10(1):263. doi:10.1186/s13643-021-01821-3
- Miake-Lye IM, Hempel S, Shanman R, Shekelle PG. What is an evidence map? A systematic review of published evidence maps and their definitions, methods, and products. Syst Rev. 2016;5(1):28. doi:10.1186/s13643-016-0204-x

James has 7 years of experience in epidemiology, clinical research, public health, and evidence-based healthcare. He supports researchers and healthcare professionals through the whole evidence synthesis process, from refining a question and planning a protocol to reporting the results. Areas of expertise Systematic…