
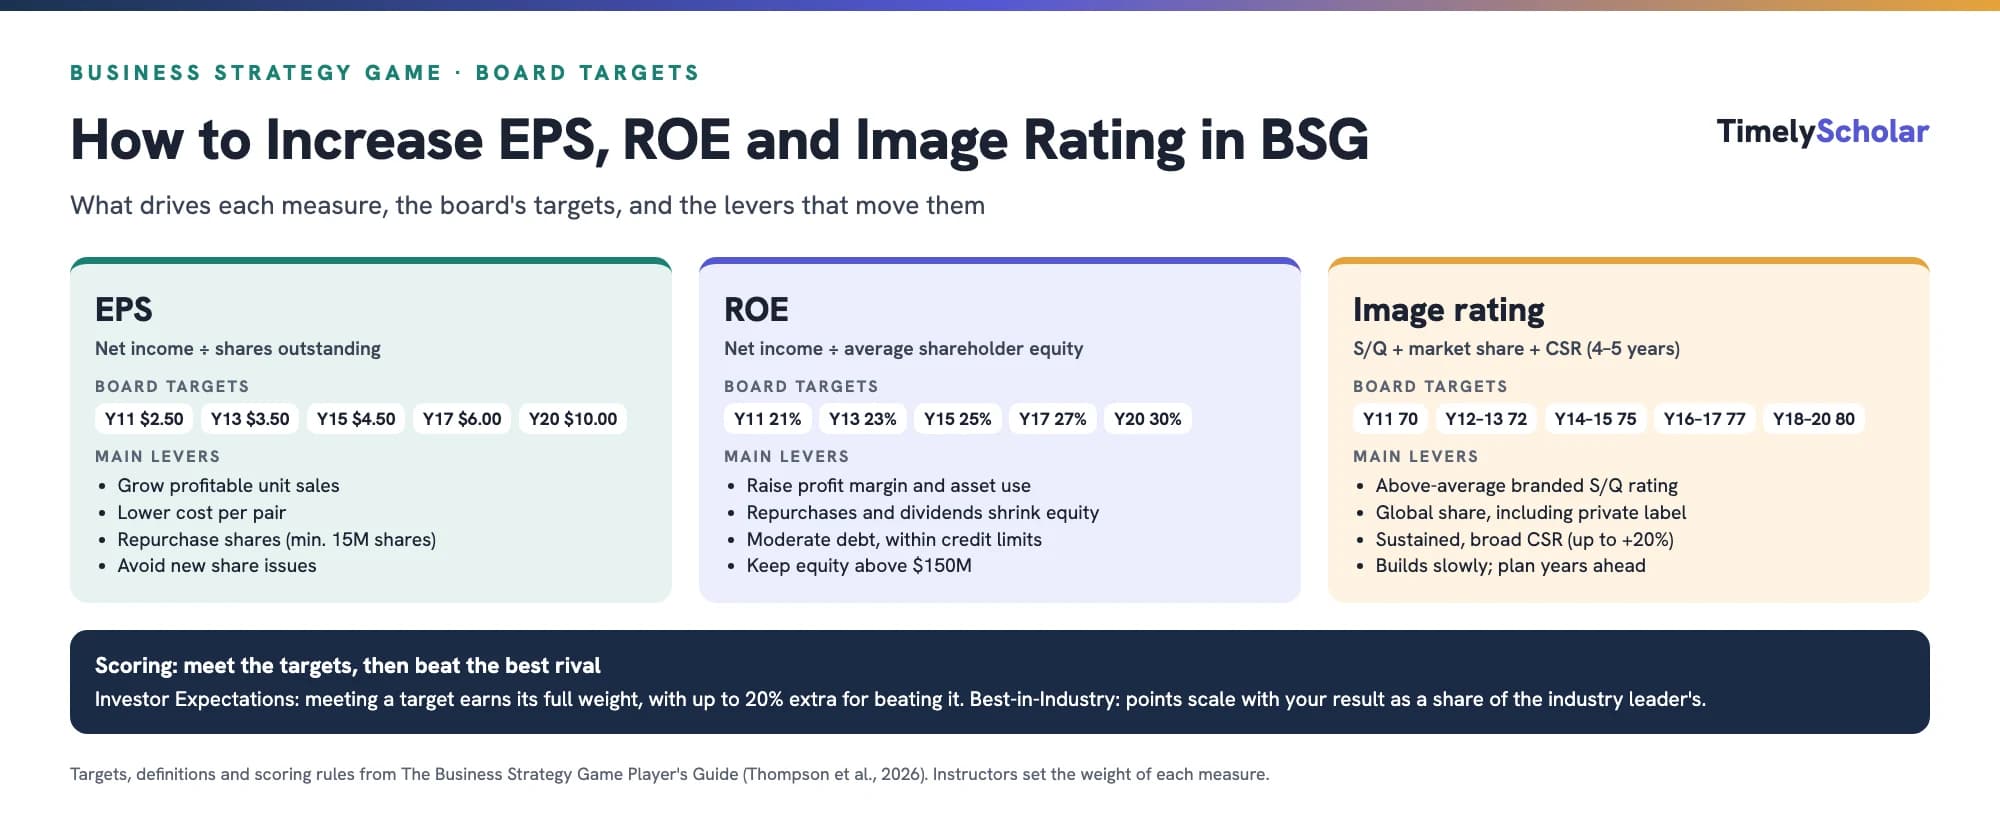
In the Business Strategy Game (BSG), EPS is net income divided by shares outstanding. You increase it by growing profitable sales, lowering cost per pair, and repurchasing shares rather than issuing new ones. ROE is net income divided by average shareholder equity. Because retained profits keep adding to equity, profit must grow faster than equity: raise margins, use assets fully, and return surplus cash through dividends and share repurchases while keeping equity above the board's $150 million minimum. The image rating combines your branded S/Q ratings, your global market share (branded plus private-label), and four to five years of corporate social responsibility. It rises slowly, so plan for it years ahead. All three are board targets, and your score depends on meeting them and on how close you come to the best company in your industry (Thompson et al., 2026).
Playing the Business Strategy Game? Get coaching on strategy and the reports. Get a free quote →
The board's targets for EPS, ROE, and image rating
Your company's board sets five performance targets each year: earnings per share (EPS), return on equity (ROE), stock price, credit rating, and image rating. The targets rise steadily, so a company that simply repeats its Year 10 performance falls further behind each year (Thompson et al., 2026).
BSG board targets for EPS, ROE and image rating (Thompson et al., 2026)
| Year | EPS | ROE | Image rating |
|---|---|---|---|
| Year 10 (actual) | $2.00 | 20% | 70 |
| Year 11 | $2.50 | 21% | 70 |
| Year 12 | $3.00 | 22% | 72 |
| Year 13 | $3.50 | 23% | 72 |
| Year 14 | $4.00 | 24% | 75 |
| Year 15 | $4.50 | 25% | 75 |
| Year 16 | $5.25 | 26% | 77 |
| Year 17 | $6.00 | 27% | 77 |
| Year 18 | $7.00 | 28% | 80 |
| Year 19 | $8.50 | 29% | 80 |
| Year 20 | $10.00 | 30% | 80 |
EPS has to grow fivefold over ten years, and the steepest increases come at the end. That means the investments you make in Years 11 to 14, such as capacity in growing regions, cumulative quality, and image, decide whether the later targets are reachable. For how the targets connect to your strategic objectives, see vision, mission and objectives in BSG.
How BSG scores EPS, ROE, and image rating
Your instructor assigns a weight to each of the five measures, adding up to 100 points. Each measure is then scored in two ways (Thompson et al., 2026):
Investor Expectations standard. Meeting a target earns its full weight. Beating it adds 0.5% for every 1% above target, up to a maximum of 20% extra (reached by beating the target by 40%). Falling short earns a proportional share: reaching half the target earns half the points.
Best-in-Industry standard. The industry leader on EPS, ROE, stock price, and image rating earns full points for that measure, provided the leader also met the target. Every other company earns points in proportion to its result divided by the leader's. Credit rating points scale down from A+.
Three practical lessons follow. First, check your instructor's weights; they tell you which measures matter most in your class. Second, because a shortfall costs points in proportion, it usually pays to come close on every measure rather than overshoot one and badly miss another. Third, under the Best-in-Industry standard, your score depends on your rivals' results, so steady improvement relative to the leader matters every year.
How to increase EPS in BSG
EPS equals net income divided by shares outstanding. The company earned $40 million in Year 10 on 20 million shares, for an EPS of $2.00 (Thompson et al., 2026). There are only two ways to raise EPS: earn more profit, or spread it over fewer shares.
Raise net income
Grow profitable unit sales. Win share in regions where your competitive effort beats the average on price, S/Q rating, models, and marketing, and add capacity where demand grows fastest.
Lower cost per pair. Reject rates, set-up costs from too many models, tariffs and freight on cross-region shipments, and idle capacity all eat into profit. Our internal analysis and value chain guide show how to find them.
Price for profit, not just volume. A price cut must raise sales enough to offset the thinner margin. Our competitive strategy guide works through the arithmetic.
Fill spare capacity profitably with private-label contracts priced above direct cost per pair.
Control interest costs. Interest expense comes straight out of net income; refinancing or paying down expensive debt helps.
Reduce shares outstanding
Share repurchases retire shares and raise EPS, ROE, and the stock price. The board limits how many shares you can buy each year, and you cannot repurchase if last year's stock price was below $15, if shares outstanding would fall below 15 million, or if equity would fall below $150 million. You also cannot issue and repurchase shares in the same year. The repurchase price rises the more shares you buy (Thompson et al., 2026). New share issues do the opposite: they dilute EPS and lower ROE, so Thompson et al. (2026) advise using them cautiously.
Net income needed for the Year 11 EPS target of $2.50 (illustrative)
| Shares outstanding | Net income needed | Change from Year 10's $40 million |
|---|---|---|
| 20 million (no repurchase) | $50.0 million | +25% |
| 18 million | $45.0 million | +12.5% |
| 16 million | $40.0 million | No change |
Repurchases are powerful but not free. Real companies that just miss analysts' EPS forecasts are more likely to buy back shares, and those buybacks tend to come with cuts in employment and investment (Almeida et al., 2016). The BSG lesson is the same: do not fund buybacks with cash you need for capacity, quality, or a healthy credit rating, since all three drive future earnings and two are scored.
How to increase ROE in BSG
BSG defines ROE as net income divided by the average of shareholder equity at the start and end of the year (Thompson et al., 2026). The formula appears in a note below the balance sheet in your Company Operating Reports. A 20% ROE on $40 million of Year 10 earnings implies average equity of about $200 million.
The catch is that equity grows automatically. Each year, net income minus dividends is added to retained earnings, so equity rises unless you return cash to shareholders. To reach a higher ROE target, profit must grow faster than equity.
Net income needed for the Year 11 ROE target of 21% (illustrative)
| Average shareholder equity | Net income needed |
|---|---|
| $180 million | $37.8 million |
| $200 million | $42.0 million |
| $220 million | $46.2 million |
A useful way to diagnose ROE is DuPont analysis, which splits returns into profit margin and asset turnover (Soliman, 2008), with financial leverage as the third factor for ROE. Each points to BSG levers:
The three drivers of ROE and their BSG levers
| Driver | What it measures | BSG levers |
|---|---|---|
| Profit margin | Net income ÷ revenue | Lower cost per pair, sensible pricing, fewer rejects, lower interest costs |
| Asset turnover | Revenue ÷ total assets | Run plants near capacity, add private-label volume, avoid idle facilities and excess inventory |
| Financial leverage | Total assets ÷ equity | Dividends and share repurchases reduce equity; moderate borrowing adds assets without adding equity |
Leverage has a limit. More debt raises ROE, but your credit rating, another board target, depends on interest coverage, the debt-to-assets ratio, and the default risk ratio. A default risk ratio below 2.0 is rated high risk (Thompson et al., 2026). Higher dividends also support the stock price, but the maximum dividend is twice projected EPS, and no dividend is allowed if it would push equity below $150 million.
How EPS and ROE drive your stock price
The stock price target rises from $30 at the end of Year 10 to $250 in Year 20. Thompson et al. (2026) say the stock price depends on revenue growth, EPS growth, ROE, credit rating, dividend growth, and how consistently you meet the five board targets. The board expects these gains if you meet or beat the EPS targets, raise the dividend from time to time, and repurchase some shares. In practice, a company that hits its EPS and ROE targets every year usually meets its stock price target as well.
How to increase your image rating in BSG
Every company starts with an image rating of 70. The rating is updated at the end of each year from three components, and nothing you do changes it within the year (Thompson et al., 2026):
The three components of the BSG image rating
| Component | How to improve it |
|---|---|
| Global average branded S/Q rating | Keep branded S/Q ratings above the industry average in every region |
| Global market share of total footwear sales | Grow branded and private-label volume; private-label pairs count toward share |
| Corporate social responsibility and citizenship (past 4–5 years) | Sustained spending on several CSR initiatives, not token amounts |
S/Q rating
Because the S/Q rating is one-third of the formula and also drives sales, it is usually the most efficient image lever. Our guide to the BSG S/Q rating and how to increase it explains the five factors behind it and what each star costs.
Market share
Market share counts total footwear sales, including private-label pairs. Winning private-label contracts therefore lifts image as well as filling capacity, provided the bids are profitable (Thompson et al., 2026).
Corporate social responsibility
The CSR page offers optional initiatives: recycled packaging, energy efficiency, charitable contributions, ethics training and enforcement, better working conditions, and a supplier code of conduct with compliance monitoring. Sustained spending can raise the image rating by as much as 20%, but only if the effort is comprehensive (several initiatives), more than token, and kept up for at least four to five years. Page 3 of the Footwear Industry Report shows the image points rivals earn from CSR. CSR is optional, and a good image rating is possible without it (Thompson et al., 2026).
Real-world evidence supports CSR as more than a cost. A second-order meta-analysis combining 25 earlier meta-analyses found a robust positive link between corporate social performance and financial performance, with corporate reputation an important factor (Busch & Friede, 2018).
Image works twice: A higher image rating also pays off beyond its own score. Last year's image rating influences buyers' brand choices and how easily you recruit retailers this year, and it breaks ties in private-label bidding (Thompson et al., 2026).
Balancing EPS, ROE and image rating
The three measures sometimes pull in different directions. The table below shows common trade-offs:
Common trade-offs among BSG performance measures
| Decision | Short-term effect | Longer-term effect |
|---|---|---|
| Cutting TQM/Six Sigma or styling spending | EPS and ROE up | S/Q falls, so sales and image fall |
| Stopping CSR spending | EPS up slightly | Image gains from CSR fade |
| Large share repurchase funded by debt | EPS and ROE up | Credit rating may drop; interest costs rise |
| Building a new plant | EPS and ROE down (depreciation, interest, more assets) | More capacity and lower tariffs support growth |
| Issuing new shares | EPS and ROE diluted | Can repair the credit rating or fund growth |
Strong teams look several years ahead, accept a dip in one measure when it buys a lasting gain, and avoid short-term moves that damage the measures that build slowly, such as S/Q and image. The 3-Year Strategic Plan module is a natural place to work this out.
Example annual plan (hypothetical)
Year 12 goal: EPS of $3.00, ROE of 22%, and image rating of 72.
Profit: add 1 million pairs of capacity in Asia-Pacific to serve the fastest-growing region without tariffs, and keep cost per pair below the industry average.
Shares: repurchase up to the board's limit only if the projected credit rating stays at B+ or better and cash covers planned capacity.
Equity: hold the dividend steady and let repurchases keep equity growth slower than profit growth.
Image: keep branded S/Q 0.3 stars above average, bid for private-label volume, and continue three CSR initiatives at meaningful levels.
Common mistakes when chasing EPS, ROE, and image rating
Focusing on one measure while missing others by a wide margin, which costs points in proportion.
Ignoring your instructor's weights, which decide how much each measure is worth.
Buying back shares with borrowed money until the credit rating falls.
Cutting quality, training, or CSR to hit this year's EPS, which weakens the S/Q and image ratings for years.
Letting equity pile up through retained earnings, which drags ROE down as targets rise.
Starting image-building too late; CSR needs four to five years to pay off fully.
Leaving a tiny cash cushion, which risks an overdraft loan at a higher interest rate.
For the first decision round, see our BSG Year 11 strategy guide; for the strategic picture, see how to craft a strategy that beats your rivals in BSG.
Getting help with your BSG decisions
If you would like a strategy specialist to talk through your financial targets, image rating plan, or 3-Year Strategic Plan, see our Business Strategy Game coaching. We explain the reasoning so your team makes its own decisions, in line with your course's rules.
Frequently asked questions
How do you increase ROE in BSG?
Grow net income faster than shareholder equity. Raise profit margins, run plants near capacity, and return surplus cash through dividends and share repurchases, while keeping equity above $150 million and your credit rating on target.
How do you increase EPS in BSG?
Increase net income through profitable sales growth and lower cost per pair, and reduce shares outstanding through share repurchases. Avoid issuing new shares, which dilutes EPS.
How do you increase the image rating in BSG?
Keep branded S/Q ratings above average, grow global market share (private-label pairs count), and spend meaningfully on several CSR initiatives for four to five years. The image rating updates at the end of each year.
Do stock buybacks increase EPS in BSG?
Yes. Repurchases reduce shares outstanding, which raises EPS, ROE, and the stock price. The board limits annual repurchases, and you need at least 15 million shares, $150 million of equity, and a prior-year stock price of $15 or more.
Does CSR spending increase image rating in BSG?
It can raise the image rating by up to 20%, but only with comprehensive, more-than-token spending on several initiatives sustained for at least four to five years. A good image rating is also possible without CSR.
How is the stock price determined in BSG?
By revenue growth, EPS growth, ROE, credit rating, dividend growth, and how consistently the company meets its five board targets.
How is BSG scored?
On two standards. Investor Expectations rewards meeting or beating the board's targets, with up to 20% bonus points. Best-in-Industry compares your EPS, ROE, stock price, and image rating with the industry leader's and your credit rating with A+.
What happens if you miss a target in BSG?
Under the Investor Expectations standard, you earn a proportional share of that measure's points. For example, reaching half the EPS target earns half the EPS points.
References
- Almeida, H., Fos, V., & Kronlund, M. (2016). The real effects of share repurchases. Journal of Financial Economics, 119(1), 168–185. https://doi.org/10.1016/j.jfineco.2015.08.008
- Busch, T., & Friede, G. (2018). The robustness of the corporate social and financial performance relation: A second-order meta-analysis. Corporate Social Responsibility and Environmental Management, 25(4), 583–608. https://doi.org/10.1002/csr.1480
- Soliman, M. T. (2008). The use of DuPont analysis by market participants. The Accounting Review, 83(3), 823–853. https://doi.org/10.2308/accr.2008.83.3.823
- Thompson, A. A., Stappenbeck, G. J., & Reidenbach, M. A. (2026). The Business Strategy Game player's guide (2026 ed.). GLO-BUS Software. https://www.bsg-online.com