
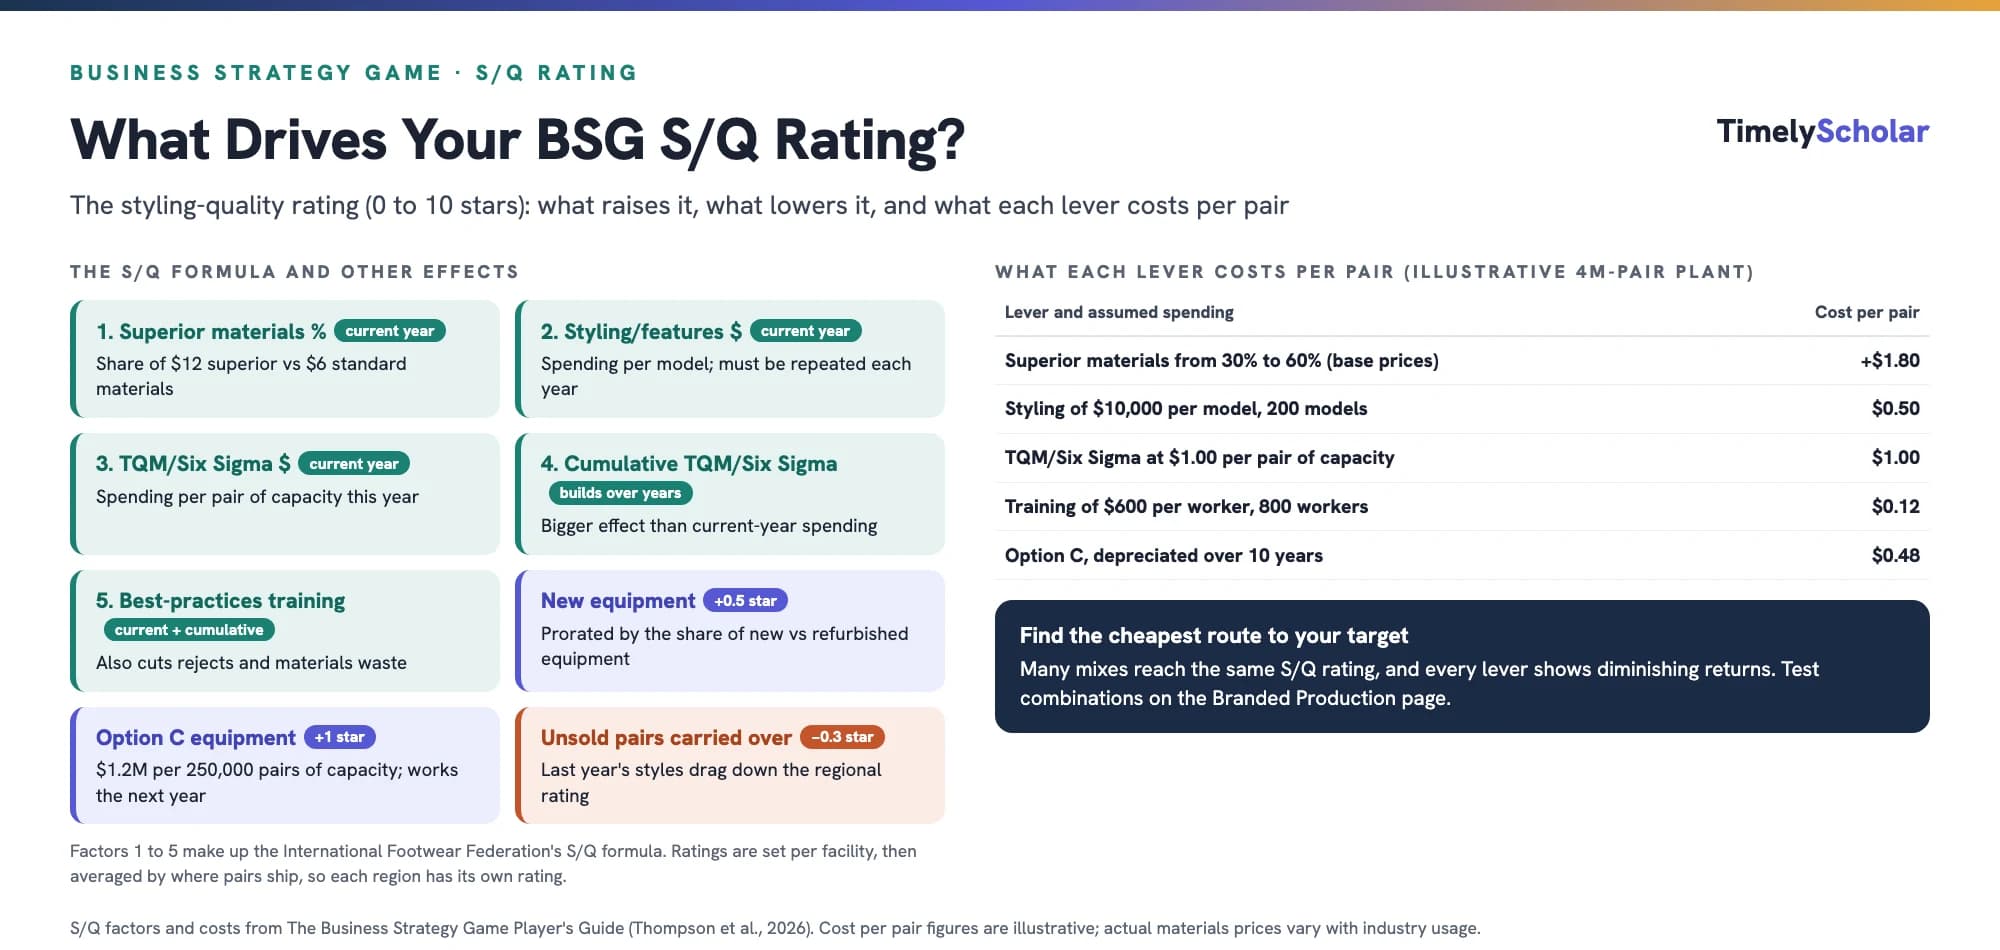
In the Business Strategy Game (BSG), the S/Q rating stands for styling/quality. It is a 0-to-10-star score the International Footwear Federation gives each company's footwear in each region, and it is one of the three most important factors in buyers' brand choices, along with price and the number of models (Thompson et al., 2026). Five things set it: the percentage of superior materials, current styling/features spending per model, current TQM/Six Sigma spending, cumulative TQM/Six Sigma spending, and current and cumulative best-practices training. New equipment adds up to 0.5 stars, Production Improvement Option C adds 1 star, and unsold pairs carried into the next year lose 0.3 stars. To increase your S/Q rating cost-effectively, invest steadily in TQM/Six Sigma and training, then use materials and styling to fine-tune it each year, testing combinations for the lowest cost per pair.
Playing the Business Strategy Game? Get coaching on strategy and the reports. Get a free quote →
What is the S/Q rating in BSG?
The S/Q rating is the simulation's measure of how stylish and well made a company's athletic footwear is. In the game, an independent consumer group, the International Footwear Federation, collects data from every company each year and rates the styling and quality of each brand from 0.0 to 10.0 stars. Buyers follow these ratings closely when they choose a brand (Thompson et al., 2026).
Three features of the rating often confuse new players (Thompson et al., 2026):
- It is rated by plant, then averaged by region. Each production facility earns its own rating. Your rating in a region is the weighted average of the facilities that shipped pairs there, adjusted for any unsold pairs from last year. Shipping more pairs from a higher-rated plant to a region raises your rating there.
- You have up to eight S/Q ratings. There is one for branded and one for private-label footwear in each of the four regions: North America, Europe-Africa, Asia-Pacific, and Latin America.
- It is recalculated every year. Because current-year spending counts, cutting spending this year lowers this year's rating.
In real markets, perceived quality combines several dimensions, such as performance, features, reliability, durability, and aesthetics (Garvin, 1987). BSG folds the ones that matter for athletic footwear into a single styling-and-quality score.
Why the S/Q rating matters so much
Your S/Q rating affects your company in more places than any other single production decision:
| Area | How S/Q matters |
|---|---|
| Branded sales and market share | Usually the second or third most important buying factor in both wholesale and online sales |
| Retail outlets | Your regional S/Q rating is one of four factors that decide how many retailers want to carry your brand |
| Image rating | Global average branded S/Q is one of the three components of the image rating, a board target |
| Private-label contracts | Bids qualify only if the S/Q rating meets a minimum set from last year's industry average |
| Pricing power | An above-average S/Q rating can support a higher price, but only up to the point buyers see the premium as worth it |
As with every competitive factor in BSG, what drives sales is the size of your gap from the all-company average in a region. A rating 1.5 stars above average gives far more buyer appeal than one 0.1 stars above. If every company has the same rating, S/Q has no effect on market shares at all (Thompson et al., 2026).
Real-world evidence points the same way. Using the PIMS database, Jacobson and Aaker (1987) found that higher relative product quality can raise profitability, both by supporting market share and by supporting a focused, premium position. A meta-analysis of quality management studies also linked quality practices to better operational and financial performance, with effects that depend on circumstances (Nair, 2006).
How the S/Q rating is calculated
Thompson et al. (2026) do not publish the exact formula, but they name the five factors the International Footwear Federation uses:
| Factor | Timing | What to know |
|---|---|---|
| 1. Percentage of superior materials | Current year | Base prices are $6 per pair for 100% standard and $12 for 100% superior materials, adjusted for industry-wide usage |
| 2. Styling/features spending per model | Current year | Needed every year to keep the lineup in fashion; the spending is per model, so more models cost more |
| 3. Current TQM/Six Sigma spending | Current year | Entered per pair of capacity; also lowers reject rates |
| 4. Cumulative TQM/Six Sigma spending | Builds over years | Has a bigger effect than current-year spending, reflecting learning and experience |
| 5. Best-practices training | Current year and cumulative | Spending per worker; also lowers reject rates and materials waste and lifts productivity |
Three rules govern how these factors work together (Thompson et al., 2026):
- Diminishing returns. Raising styling spending from $5,000 to $10,000 per model helps more than raising it from $10,000 to $15,000. Likewise, raising TQM/Six Sigma spending from $0.50 to $1.00 per pair of capacity helps more than going from $1.00 to $1.50.
- Consistency beats bursts. Cumulative TQM/Six Sigma spending outweighs current spending, so on-again, off-again programs waste money.
- You see the effect immediately. The Branded Production page recalculates your projected S/Q rating each time you change an entry, so you can test combinations before saving.
These rules mirror how quality programs work in real companies. Thompson (2025, Chapter 11) notes that total quality management (TQM) shows little benefit in its first six months and pays off through a long-term culture of continuous improvement. Six Sigma programs use statistical methods to cut defects to no more than 3.4 per million. In BSG, both are entered as one TQM/Six Sigma spending decision per facility.
Other things that raise or lower your S/Q rating
Beyond the five factors, four decisions move the S/Q rating (Thompson et al., 2026):
- New versus refurbished equipment. New equipment adds 0.5 stars to the pairs it produces, compared with refurbished equipment. The benefit is prorated, so a plant with half new equipment gains 0.25 stars. New equipment also raises productivity by 500 pairs per worker and cuts reject rates by 20%.
- Production Improvement Option C. Special equipment that raises the S/Q rating by 1 star. It costs $1.2 million per 250,000 pairs of installed capacity and takes effect the year after you order it. Each facility can have at most two improvement options over its life, one per year.
- Unsold pairs carried over. Pairs left in inventory lose 0.3 stars because they are last year's styles, which drags down your regional rating. Clearing old inventory at the start of the year removes the penalty but at a discounted price.
- Where you ship from. Because regional ratings are weighted averages, shifting shipments from a lower-rated plant to a higher-rated one raises the rating in that region.
How to increase your S/Q rating in BSG, step by step
- Set a target relative to rivals. Look at last year's regional averages in the Competitive Intelligence Report and the projected averages you entered as competitive assumptions. Decide how far above or below the average your strategy requires.
- Start the long-term levers early. Steady TQM/Six Sigma spending and best-practices training build cumulative benefits that rivals cannot buy quickly, and they also lower reject rates and costs.
- Use materials and styling to fine-tune. These act this year, so they close a gap fast. They also have to be paid for every year.
- Compare combinations for the lowest cost per pair. Thompson et al. (2026) stress that several mixes reach the same rating, and some cost much less than others.
- Consider capital options when the payback is clear. Option C or new equipment makes sense when you will produce enough pairs over the remaining years to spread the investment.
- Avoid carrying over unsold pairs. Produce close to expected demand, and clear excess inventory when the 0.3-star penalty and $1.00 storage cost per pair outweigh the discount.
- Check the result after each round. Compare your actual regional ratings with rivals' and adjust next year's inputs.
For how S/Q fits into your first decision round, see our BSG Year 11 strategy guide.
What a higher S/Q rating costs per pair
Every star has a price. The table below estimates the cost per pair of each lever for an illustrative plant producing 4 million pairs with 200 models and 800 workers. All spending levels are hypothetical; prices and capital costs use the game's base rates (Thompson et al., 2026).
| Lever and assumed spending | Annual cost | Cost per pair |
|---|---|---|
| Superior materials raised from 30% to 60% (at base prices) | $7.2 million more | +$1.80 |
| Styling/features at $10,000 per model, 200 models | $2.0 million | $0.50 |
| TQM/Six Sigma at $1.00 per pair of capacity | $4.0 million | $1.00 |
| Best-practices training at $600 per worker, 800 workers | $0.48 million | $0.12 |
| Option C ($19.2 million) depreciated over 10 years | $1.92 million | $0.48 |
Two points stand out. First, materials are the most expensive lever per pair in this example, and their price is not fixed. If industry-wide use of superior materials rises above 40%, the price of superior materials climbs 2% for every 1% above that level (Thompson et al., 2026). When every team chases S/Q with materials, everyone pays more. Second, training and TQM/Six Sigma do double duty. They raise S/Q and also cut reject rates, and training can trim materials waste by up to 20% a year over time, so part of their cost comes back as savings.
To see where your costs stand against rivals', use the benchmarking approach in our guide to BSG internal analysis and value chain benchmarking.
What S/Q rating should you target?
There is no single right number. The best target depends on your competitive strategy and what rivals do:
| Strategy | Typical S/Q target | Why |
|---|---|---|
| Broad low-cost | Near or slightly below the industry average | Enough to keep buyers interested while keeping costs per pair low |
| Broad differentiation | Well above average | S/Q is a main source of buyer appeal and price premium |
| Best-cost provider | Above average, at a lower cost per pair than rivals with similar ratings | Offers more quality for the money |
| Focused (one or two regions) | High in the focus regions, lower elsewhere | Plants can have different S/Q ratings, so ratings can differ by region |
| Private-label supplier | The minimum the contract requires | Extra stars add cost but win no contracts; lowest price wins |
For private-label footwear, the required rating is 1 star below the prior year's worldwide average branded S/Q rating, with the requirement capped at 5.0 stars (Thompson et al., 2026). For choosing the strategy itself, see our guide to BSG low-cost, differentiation, best-cost and focus strategies.
Remember that the average moves. If rivals raise their ratings, holding yours steady means falling behind. Estimate where the industry average will be next year, not where it was last year.
S/Q rating and image rating
Many players search for how to increase their image rating, and S/Q is a big part of the answer. The image rating combines three things: your global average branded S/Q rating, your global market share of total footwear sales (branded and private-label), and your corporate citizenship and social responsibility actions over the past four to five years (Thompson et al., 2026).
The image rating is one of the board's five performance targets, and last year's image rating also influences buyers and retailers this year. A sustained S/Q lead therefore pays twice: once in this year's sales and again through next year's image. For the other image components and the financial targets, see our guide on how to increase EPS, ROE and image rating in BSG. For how the board's targets fit together, see vision, mission and objectives in BSG.
Explaining your S/Q decisions in BSG assignments
Instructors often ask teams to justify production decisions in strategy statements, reflections, or the 3-Year Strategic Plan. A strong explanation links the S/Q target to the strategy, shows the cost, and compares results with rivals.
Target: an S/Q rating 0.5 stars above the projected industry average in all four regions, consistent with our best-cost strategy.
Approach: steady TQM/Six Sigma spending and best-practices training at both plants to build cumulative quality, with superior materials kept near 40% to avoid paying a premium if industry usage rises.
Capital: new rather than refurbished equipment when North America's original equipment is replaced in Year 15.
Check: if our regional rating falls below the target, raise styling spending first, since it acts in the same year at a lower cost per pair than materials.
For how to frame the overall strategy, see how to craft a strategy that beats your rivals in BSG.
Common S/Q rating mistakes in BSG
- Chasing stars without a reason. A high rating only pays if buyers value it more than its cost, and if your price and other factors keep it competitive.
- Relying only on superior materials, the costliest lever, whose price rises when many teams do the same.
- Cutting TQM/Six Sigma or training to save money, which lowers this year's rating and slows the cumulative build-up.
- Over-producing, so that carried-over pairs lose 0.3 stars and cost $1.00 each to store.
- Targeting last year's average instead of where rivals are likely to be next year.
- Overshooting private-label requirements, which adds cost without helping win bids.
Getting help with your BSG decisions
If you would like a strategy specialist to talk through your S/Q targets, production costs, or 3-Year Strategic Plan, see our Business Strategy Game coaching. We explain the reasoning so your team makes its own decisions, in line with your course's rules.
Frequently asked questions
What does S/Q rating stand for in BSG?
Styling/quality. It is a 0-to-10-star rating of each company's footwear styling and quality, assigned each year by the International Footwear Federation in the simulation.
How do you increase the S/Q rating in the Business Strategy Game?
Raise the percentage of superior materials, spend more on styling/features per model, increase TQM/Six Sigma and best-practices training spending, install new equipment or Production Improvement Option C, and avoid carrying unsold pairs into the next year.
What is a good S/Q rating in BSG?
It depends on your strategy and rivals. What matters is your rating compared with the regional average: differentiators aim well above it, low-cost companies stay near it, and private-label suppliers meet only the contract minimum.
What is TQM in BSG?
Total quality management. In BSG, TQM/Six Sigma spending is entered per pair of capacity at each plant. Both current and cumulative spending raise the S/Q rating, and cumulative spending has the bigger effect. It also lowers reject rates.
Does best-practices training increase S/Q rating?
Yes. Current and cumulative training spending is one of the five S/Q factors. Training also reduces reject rates, cuts materials waste, and raises worker productivity, with diminishing returns as spending rises.
Why did my S/Q rating drop in BSG?
Common causes are cutting current spending on materials, styling, or TQM/Six Sigma; rivals raising their ratings; the 0.3-star penalty on unsold pairs carried over; or shipping more pairs from a lower-rated plant to that region.
Does S/Q rating affect image rating?
Yes. The image rating is based on global average branded S/Q rating, global market share, and corporate citizenship over the past four to five years.
What S/Q rating do private-label bids require?
One star below the prior year's worldwide average branded S/Q rating, with the requirement capped at 5.0 stars, plus 100 models.
References
- Garvin, D. A. (1987). Competing on the eight dimensions of quality. Harvard Business Review, 65(6), 101–109. https://hbr.org/1987/11/competing-on-the-eight-dimensions-of-quality
- Jacobson, R., & Aaker, D. A. (1987). The strategic role of product quality. Journal of Marketing, 51(4), 31–44. https://doi.org/10.1177/002224298705100404
- Nair, A. (2006). Meta-analysis of the relationship between quality management practices and firm performance: Implications for quality management theory development. Journal of Operations Management, 24(6), 948–975. https://doi.org/10.1016/j.jom.2005.11.005
- Thompson, A. A. (2025). Strategy: Core concepts and analytical approaches (8th ed.). McGraw Hill.
- Thompson, A. A., Stappenbeck, G. J., & Reidenbach, M. A. (2026). The Business Strategy Game player's guide (2026 ed.). GLO-BUS Software. https://www.bsg-online.com