
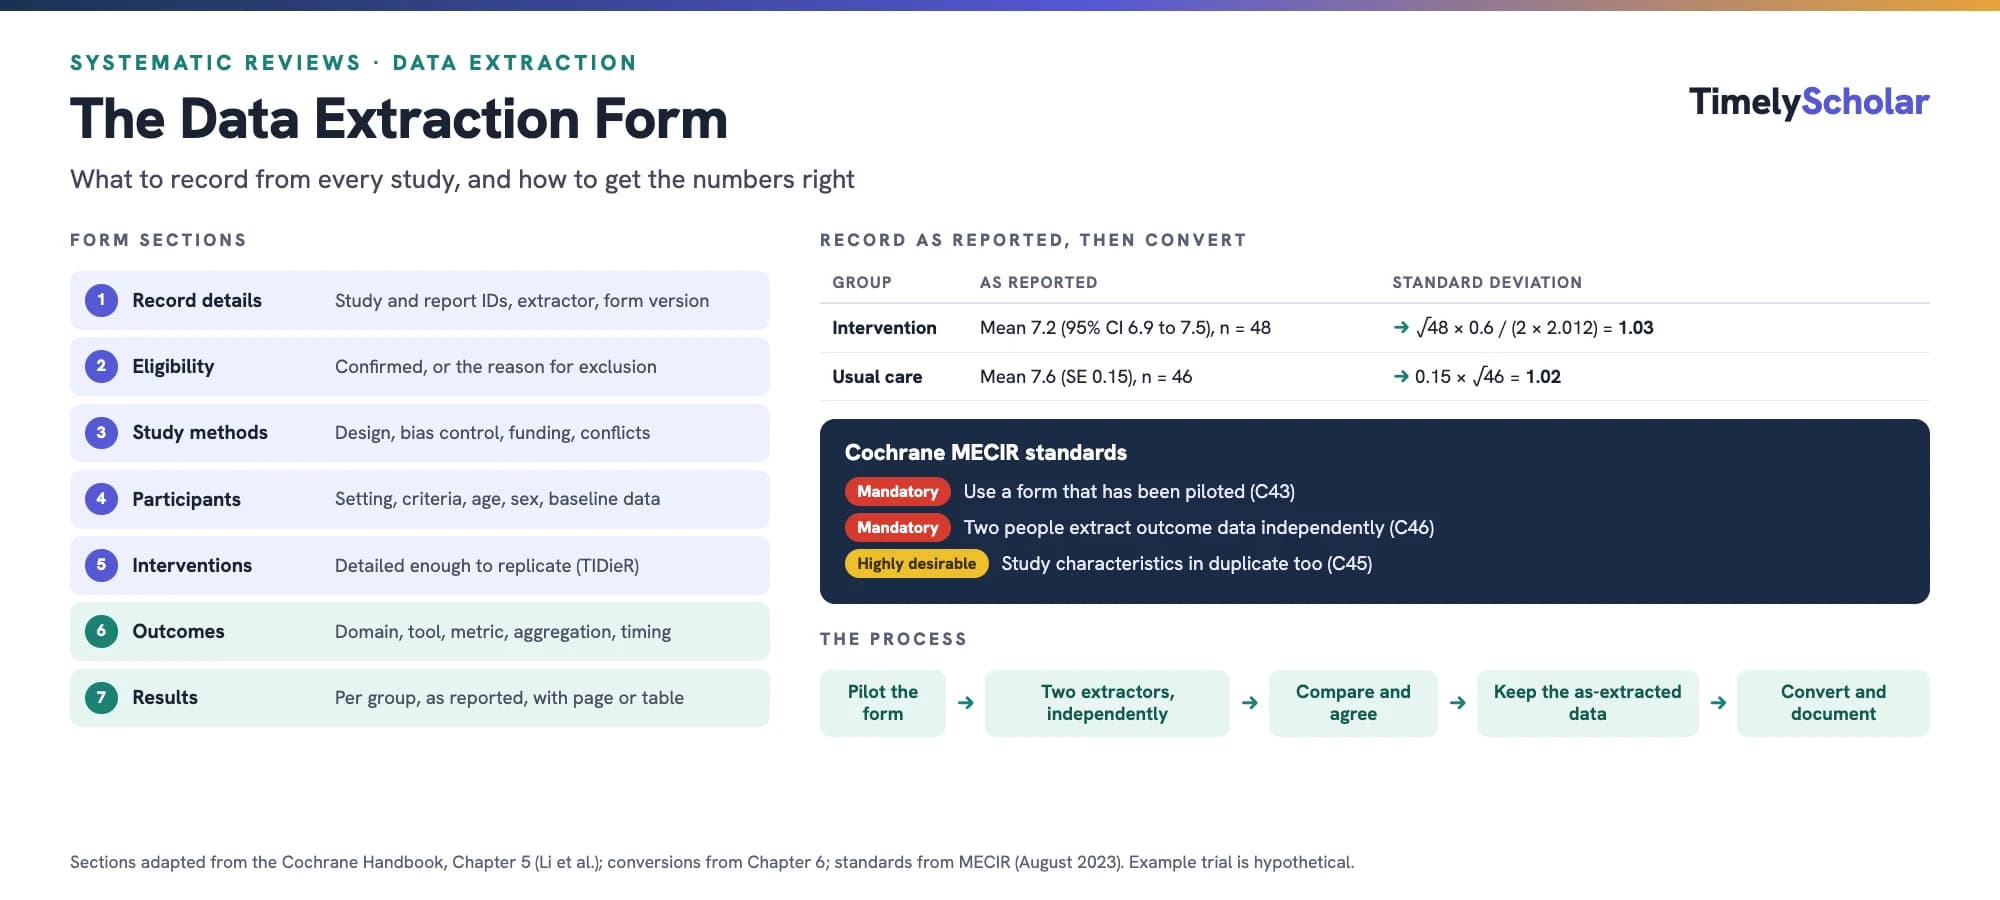
A systematic review data extraction form is the structured form on which reviewers record, for every included study, the information the review needs: record details, eligibility, study methods, participants, interventions, outcomes, and results [1]. Cochrane requires a form that has been piloted, and outcome data extracted by at least two people working independently [2]. Record numbers as the study reports them, note where you found each one, and do any conversions, such as standard error to standard deviation, in a separate, documented step [1]. This guide gives a field-by-field template, the numbers to extract for each outcome type, the conversion formulas, a worked example, the evidence on double extraction and AI tools, and how to report extraction under PRISMA 2020 [3].
Working on a systematic review? A PhD-led reviewer can help at any stage. Get a free quote →
What is a data extraction form in a systematic review?
The Cochrane Handbook defines data broadly, as any information about or derived from a study, including details of its methods, participants, setting, context, interventions, outcomes, results, publications, and investigators. The data you collect should describe the included studies, support the review's tables and figures, feed the risk of bias assessment, and make synthesis and meta-analysis possible [1].
The form is the bridge between the study reports and your review. It is also the historical record of where every number came from and of the decisions made along the way. Forms can be paper or word-processor documents, electronic forms such as a Google Form, or data systems such as Covidence, EPPI-Reviewer, or the Systematic Review Data Repository (SRDR) [1].
The key, in the Handbook's words, is to build easy-to-use forms and to collect sufficient, unambiguous data that faithfully represent the source [1]. The data to be sought should be described in your protocol [1], and if you work to JBI methods, the protocol should name the extraction instrument and process [4].
Data extraction vs data charting. Scoping reviews traditionally call this step charting, and they collect broader, more descriptive data than an effectiveness review. If you are mapping evidence rather than estimating an effect, see our guide to data charting in scoping reviews.
Free form builder: Tick the items you need, add your review-specific items, and download a Word form or a spreadsheet with our free data extraction form builder. Its items follow the Cochrane checklist below.
Data extraction form template: what fields to include
This template follows the Cochrane Handbook's checklist of items to consider in data collection (Table 5.3.a) and its advice on form design [1]. Keep the items that your review question, tables, and analyses need, and add review-specific items.
Systematic review data extraction form template, by section (adapted from the Cochrane Handbook, chapter 5 [1])
| Section | Fields to include | Notes |
|---|---|---|
| Record details | Review title; form version number and date; study ID and report ID; extractor name; date of extraction | A study can have several reports, so record both IDs. A version number stops anyone using an outdated form. |
| Eligibility | Confirm the study is eligible; reason for exclusion if not | Excluded studies still need a recorded reason. |
| Study methods | Design (parallel, crossover, cluster, factorial, or non-randomized design features); single-center or multicenter; recruitment and sampling; enrollment dates and follow-up; methods to control bias; handling of missing data; unit of analysis; statistical methods; trial registration number; funding source; authors' conflicts of interest | Record what you need for the risk-of-bias tool, with verbatim quotes. Funding and conflicts of interest are particularly important. |
| Participants | Setting; country or region; eligibility and diagnostic criteria; number randomized or enrolled; age; sex; other baseline characteristics (such as comorbidity or socioeconomic status) | Always collect age and sex summaries. Diagnostic criteria are an important source of diversity across studies. |
| Interventions and comparators | Components, route, dose, timing, frequency, and duration; who delivered it and where; co-interventions; definition of the control group; fidelity or adherence | Detailed enough for someone to replicate the intervention. TIDieR gives a framework. |
| Outcomes | For each outcome: domain, measurement tool (for a scale, its name, range, and whether high or low is better), specific metric, method of aggregation, and time points; adverse events | Describe in detail only the outcomes defined in your protocol. |
| Results | For each group, outcome, and time point: number randomized and analyzed; withdrawals and exclusions with reasons; summary data (such as events and totals, or means, SDs, and numbers); effect estimates with their precision; planned subgroups | Record numbers exactly as reported, with the page, table, or figure they came from. |
| Other | Key conclusions of the study authors; references to other relevant studies; correspondence required or received; notes | The authors' conclusions help you check the direction of effect. |
Two design choices make the template work [1]:
Collect neither too much nor too little. Outline the tables and figures you expect in the review first. Collecting too much makes forms longer than the original reports and wastes time; collecting too little sends you back to the reports.
Give every item a place for its source. Record where each piece of information was found, or whether it came from an unpublished source or personal communication, and quote the report directly wherever a judgment is needed.
Interventions: use the TIDieR checklist
The Handbook recommends seeking enough detail to replicate the interventions and points to the Template for Intervention Description and Replication (TIDieR) as a framework [1]. TIDieR has 12 items, and its authors suggest systematic reviewers may be guided by them when describing interventions [5]:
Brief name
Why: the rationale, theory, or goal
What: materials
What: procedures
Who provided it, with their expertise and training
How: mode of delivery, individual or group
Where: type of location and infrastructure
When and how much: number of sessions, schedule, duration, intensity, or dose
Tailoring
Modifications during the study
How well (planned): how adherence or fidelity was assessed
How well (actual): the extent to which it was delivered as planned
For drug trials, the key details are often the route, dose, timing, and length of treatment [1]. JBI likewise says that thorough extraction of intervention details is essential for reproducibility [4].
Outcomes: record all five elements
An outcome is more than a name. Cochrane asks reviewers to collect all five elements [1]:
Domain, for example anxiety.
Measurement tool: for a scale, its name, upper and lower limits, and whether a high or low score is favorable.
Specific metric, such as the value at follow-up or the change from baseline.
Method of aggregation, such as the mean and SD of scores in each group, or the proportion of people with anxiety.
Timing of the measurement.
Adverse events
For harms, useful items include any coding system used (such as MedDRA, with its version number), the name of each event, its intensity, whether it was serious, whether it was considered related to the intervention, and when it occurred. Be cautious about synthesizing adverse events that studies collected differently, and remember that no mention of adverse events in a report does not mean none occurred [1].
What numbers to extract for each type of outcome
Outcome data are usually dichotomous, continuous, ordinal, counts or rates, or time-to-event [6]. The numbers you need depend on the type:
Results data to extract, by outcome type (Cochrane Handbook, chapter 6 [6])
| Outcome type | What to extract for each group | If that is not reported |
|---|---|---|
| Dichotomous (event or no event) | Number of participants with the event and the number in the group | A reported odds ratio or risk ratio can be used only with a measure of uncertainty: an SE, a 95% CI, or an exact P value |
| Continuous | Mean, standard deviation, and the number of participants measured | Extract the SE, CI, t statistic, or P value so the SD can be calculated |
| Time-to-event | The log hazard ratio and its SE (Cox models estimate these directly) | Derive them from a hazard ratio with its CI or P value, estimate them from log-rank statistics (O − E and its variance, V), or reconstruct the data from a Kaplan-Meier curve |
| Adjusted estimates (non-randomized studies) | The adjusted effect estimate, its precision, and the variables adjusted for | Adjusted analyses are generally preferable because they usually reduce confounding |
For randomized trials, the Handbook generally recommends collecting summary data for each intervention group rather than only the effect estimate [6]. Collect the number of participants whose outcome was actually measured, rather than assuming the whole randomized sample, and take care when event counts have to be derived from percentages, because a rounded percentage can fit more than one numerator [6], and record the unit of analysis, such as participant, cluster, or body part, for each result when it is not obvious [1]. Time-to-event data should not be analyzed as continuous outcomes, for example, as mean times to the event [6].
Studies may report change from baseline, final values, or both. You can extract both when the means and SDs are available [6].
When a study reports several eligible results
A single study may report two pain scales at two time points, all compatible with a review outcome such as pain at less than six months [7]. Decide in advance how you will choose. The Handbook asks for a framework in the protocol, such as a hierarchy of preferred measures [1], and PRISMA 2020 gives example rules: the definition most common across studies, the one ranked best in a prespecified hierarchy, or the one the study investigators considered most important, such as the primary outcome [7].
In a study with more than two arms, include only the interventions that meet your eligibility criteria [2].
Converting what studies report: SE, confidence intervals, medians, and ranges
Collect outcome data in the format in which they were reported, and transform them in a later step [1]. Do conversions with a computer rather than a hand calculator, so there is a permanent record, and keep source data clearly separate from data you calculated [1]. PRISMA 2020 asks you to describe these conversions in your methods (item 13b) [3].
Standard error or confidence interval to standard deviation
From the SE of a group mean: SD = SE × √N. The SE must come from a single group, not from the difference between two groups [6].
From a 95% CI of a group mean (large samples, say more than 100 per group): SD = √N × (upper limit − lower limit) / 3.92. For 90% intervals, use 3.29 instead of 3.92; for 99% intervals, use 5.15. For groups of 60 to 100, look for evidence of which distribution the study used, and use the t distribution when in doubt [6].
Small samples: with fewer than 60 participants per group, replace 3.92 with twice the t value for N − 1 degrees of freedom. The Handbook's example has N = 25 and a 95% CI of 30.0 to 34.2, so the divisor is 2 × 2.0639 = 4.128 and SD = √25 × (34.2 − 30.0) / 4.128 = 5.09 [6].
From a P value for a mean difference: convert P to a t statistic, divide the mean difference by t to get its SE, then work back to an SD for both groups. If a study reports only P < 0.05, a conservative approach takes P = 0.05; no SD can be derived from "not significant" [6].
A particularly misleading error is to treat an SE as an SD [6]. In one study summarized by Mathes and colleagues, half of the reviews checked contained errors, and about 23% of these were misinterpretations such as confusing standard deviations with standard errors [8].
Free converters: Convert SEs and confidence intervals with our SE to SD converter, which uses the t distribution for small samples, and convert between effect measures with the effect size converter.
Medians, interquartile ranges, and ranges
Many studies report a median with an interquartile range (IQR) or range. Treat these with care, because the Handbook notes that medians are often reported precisely because the data are skewed, and then the mean and median can be very different [6].
When samples are large, and the outcome is roughly normal, an IQR is about 1.35 SDs wide. With a skewed outcome, an SD cannot be estimated from an IQR [6].
As a general rule, ranges should not be used to estimate SDs [6].
Wan and colleagues developed estimators of the SD that take the sample size into account, and found that a common shortcut, rebuilding a range from the IQR and then applying an older method, performed very poorly [9]. Luo and colleagues developed optimal estimators of the mean [10], and Shi and colleagues developed an estimator of the SD from all five numbers (minimum, quartiles, median, and maximum) [11].
For a missing mean, a simulation study found the Wan method had better properties than the Bland method, as reported in the Handbook [6,12].
These methods assume roughly normal data. Imputing missing SDs involves assumptions and is best avoided where possible; if most studies in a meta-analysis lack SDs, don't impute them. Run sensitivity analyses to test the effect of any assumptions [6].
Free converter: Our median-to-mean and SD converter applies the Luo, Wan, and Shi methods and includes a skewness check, so you can flag studies for a sensitivity analysis.
How to design a data extraction form, step by step
Design the form with the whole team: content experts, people experienced in review methods and form design, statisticians, and the extractors themselves. In most cases, write it as a document first, before building an electronic form or a data system [1]. The Handbook's four steps [1]:
Outline the review's tables and figures. This tells you how much data to collect.
Group the data elements, possibly in the order they usually appear in study reports: reference information, eligibility, intervention, statistical methods, baseline characteristics, and results.
Write closed questions where you can, with a list of permitted answers plus an "other, specify" option. Include "not applicable," "not reported," and "cannot tell" options; "cannot tell" flags items to ask the study authors about. Ask what the report says, not what happened: "Did the article report that the participants were masked to the intervention?" rather than "Were participants masked?"
Add the administrative fields: the review title, the person completing the form, the date, the form's version number and date, the study ID and report ID, instructions next to each question, and space for notes.
Paper form, spreadsheet, or data system?
Choosing a data collection tool, by review size (Cochrane Handbook, section 5.4 [1])
| Tool | Suits | Strength |
|---|---|---|
| Paper or word-processor form | Small reviews (fewer than 10 included studies) with 2 to 3 extractors in the same place | Notes and explanations are easy to record |
| Electronic form or spreadsheet | Small-to-medium reviews (10 to 20 studies) | Data can be copied into analysis software without retyping |
| Data system (such as Covidence, EPPI-Reviewer, or SRDR) | Reviews of any size, especially large ones (more than 20 studies) and reviews that need updating | Online form building, data entry by several users, data sharing, and efficient data management |
The catch with paper forms is that the data must then be entered into software for analysis, which the Handbook calls inefficient and potentially unreliable [1].
How to pilot a data extraction form
Cochrane's MECIR standards require using a data collection form that has been piloted. Piloting within the review team is highly desirable; at a minimum, the form, or a very close variant of it, must have been assessed for usability [2].
Who and how many: several people should extract data from at least a few articles [1].
What to check: draft entries for the characteristics of included studies table, and complete a risk of bias assessment from the pilot reports, to make sure the form captures everything you need [1].
Train the extractors at the start and periodically during the project [1]. Experience alone is no guarantee: in one study, error rates were similar at every level of experience, at 28.3% to 31.2% [13].
Revise, then version. If you change the form or its coding instructions after extraction has started, you may need to go back to studies already extracted [1], so give each revision a new version number and date.
Piloting is the most common recommendation in published guidance: 18 of 25 guidance documents recommend piloting forms on a sample of studies, although none of the handbooks reviewed recommends quantifying agreement during piloting [14]. PRISMA 2020 doesn't mention piloting, but the Cochrane Handbook asks for it to be reported: your protocol and methods should cover pilot testing, training, and coding instructions [1].
Should two people extract the data independently?
Yes, at least for outcome data. Errors at the extraction stage are rarely detected by peer reviewers, editors, or readers, so the Handbook recommends that more than one person extract data from every report. As a minimum, information that involves subjective interpretation and information critical to interpreting the results, such as outcome data, should be extracted independently by at least two people [1].
Cochrane MECIR standards for who extracts data [2]
| Standard | Status | What it requires |
|---|---|---|
| C45: Extracting study characteristics in duplicate | Highly desirable | At least two people working independently, with a process for resolving disagreements defined in advance |
| C46: Extracting outcome data in duplicate | Mandatory | At least two people working independently, with a process for resolving disagreements defined in advance |
Duplicate extraction may be less important for study characteristics, which is why C45 is not mandatory; outcome data feed directly into the synthesis and the review's conclusions [2]. In JBI effectiveness reviews, two or more reviewers extract data independently using JBI's standardized form, and disagreements are resolved by consensus or a third reviewer [4]. Ideally, pair extractors from complementary disciplines, such as a methodologist and a topic specialist [1].
The evidence on extraction errors
Single vs double extraction. In a pilot study, single extraction followed by verification produced more errors than double extraction (relative difference 21.7%), although it took less time (relative difference 36.1%). Effect estimates did not differ substantially for most outcomes [15].
How common errors are. A methodological review found extraction error rates of up to 50%, which often influenced effect estimates. It concluded that the evidence base for extraction standards is weak despite this high prevalence [8].
Standardized mean differences. In 17 of 27 meta-analyses (63%), at least one of the two trials examined had errors. In 10, the result for at least one trial could not be replicated within 0.1; 7 of those 10 meta-analyses were erroneous, 1 was later retracted, and in 2 a significant difference disappeared or appeared [16].
Adverse events. Across 201 systematic reviews, extraction could not be reproduced for 17.0% of 10,386 trials; the most common errors were numerical (49.2%) and ambiguous (29.9%). The errors changed the direction of the effect in 10 of 288 meta-analyses (3.5%) [17].
Depression and inflammatory markers. Errors were found in 14 of 15 meta-analyses and in 118 of 521 primary studies (22.6%). After correction, 11 of 37 pooled effect sizes (29.7%) changed by more than 0.1 [18].
Resolving disagreements
Specify the procedure or decision rule in your protocol [1].
Discuss disagreements first; if needed, ask another person to arbitrate [1].
If a disagreement can't be resolved, contact the study authors; if that fails, report the disagreement in the review [1].
Keep a copy of the data as extracted by each person, as well as the consensus data, so the reliability of coding can be assessed [1].
Agreement before consensus can be quantified with a kappa statistic, although Cochrane reviews don't routinely do this [1]. If you choose to report it, our Cohen's kappa calculator does the arithmetic.
Multiple reports, trial registries, and contacting study authors
Extract by study, not by report
A systematic review's unit of interest is the study, not the report. Never assume each study has only one report; collate all reports of the same study [1]. Useful clues for linking reports include trial registration numbers, author names, sponsors and grant numbers, location, intervention details, numbers of participants, and dates. When doubt remains, ask the authors or sponsors [1].
You can extract each report on its own form and combine them afterward, or extract all reports of a study onto a single form. Either way, decide in advance which report is the main data source when reports conflict and the conflict can't be resolved with the authors [1]. JBI also asks the protocol to set out how multiple reports, missing data, and data conversions will be handled [4].
Look beyond the journal article
Journal articles supply most of the data in systematic reviews, but they can omit outcomes, especially harms [1].
Trial registers let you compare published outcomes and results with those planned, and can provide efficacy and safety data not available elsewhere [1].
Clinical study reports often contain more data about trial methods and results than any other single source, but they are hard to access [1].
Conference abstracts are highly variable in reliability, accuracy, and detail [1].
Errata and retractions: examine them for every included study [2]. A retracted publication should not be included in the review [1].
Contacting study authors
Seeking key unpublished information that is missing from reports is highly desirable under MECIR [2], and the Handbook strongly encourages contacting the original investigators [1]. Use open-ended questions about how the study was conducted, and specific requests for numbers, possibly with a short blank or partly completed data collection form. Document all correspondence: it matters for transparency [1]. PRISMA 2020 asks you to report how you contacted investigators, what you asked for, and how successful you were [7].
Extracting data from figures and Kaplan-Meier curves
When results appear only in a figure, first ask the investigators for the numbers. Otherwise, use digitizing software: the Handbook names Plot Digitizer, Web Plot Digitizer, Engauge, Dexter, ycasd, and GetData Graph Digitizer, and notes that software is more convenient and accurate than visual estimation or a ruler [1].
In a comparison of randomized trial figures, software extraction cut extraction time by 47%, with higher interrater reliability than manual extraction; the authors concluded that manual estimation should be avoided [19]. Yet in a survey, only 33 of 589 Cochrane protocols (5.6%) mentioned extracting data from figures in their methods [20]. PRISMA 2020 asks you to name any software used to extract data from figures [7].
Kaplan-Meier curves
For time-to-event outcomes, the Handbook lists a third way to obtain hazard ratios: reconstructing approximate individual participant data from published Kaplan-Meier curves [6]. Guyot and colleagues developed an algorithm that does this from the digitized curve. Reasonable accuracy for hazard ratios requires at least the numbers at risk or the total number of events to be reported [21]. The IPD from KM R package and Shiny app implement a two-stage approach: extract the curve coordinates, then reconstruct the individual participant data [22].
Free digitizer: Calibrate the axes, click along each curve, and export the coordinates with ready-made IPD from KM R code using our Kaplan-Meier curve digitizer.
Data extraction software: spreadsheets, Covidence, and other systems
Data systems allow online form building, data entry by several users, data sharing, and efficient data management; the Handbook gives Covidence, EPPI-Reviewer, and SRDR as examples [1]. For small-to-medium reviews (10 to 20 studies), the Handbook suggests electronic forms, such as Google Forms, which can copy data to analysis software without manual re-entry [1].
Covidence, a commercial system, illustrates the features to look for. According to its help pages:
It offers two extraction modes. Extraction 1 collects structured data against defined comparison groups and suits quantitative synthesis and meta-analysis, with a PICO structure and export to RevMan. Extraction 2 is a fully customizable template for narrative, mapping, or text-heavy reviews [23].
Reviews are set to dual-reviewer extraction by default. Single-reviewer extraction can be switched on, but RevMan export is not currently supported with it [24].
Its AI extraction suggestions use Google's Gemini models and cover a fixed list of study-characteristic fields; reviewers must accept or reject each suggestion individually [25].
Can AI or ChatGPT extract data for a systematic review?
Large language models can now extract many data items accurately, but the evidence so far supports using them with human checking, not instead of it. The Handbook's chapter on collecting data, last updated in 2019, could not recommend a specific tool for automating extraction and suggested automated approaches may first act as checks on manual extraction [1]. The newer studies:
Selected evaluations of large language models for data extraction
| Study | What was tested | Main finding |
|---|---|---|
| Gartlehner et al., 2024 [26] | Claude 2 on 10 open-access randomized trial publications (a convenience sample) | 96.3% accuracy across 160 data elements; 6 errors, 4 of them missed items |
| Konet et al., 2024 [27] | Claude 2 and GPT-4 with a PDF plug-in | 96.3% vs 68.8% accuracy, with most GPT-4 errors due to the plug-in; humans should still validate extractions |
| Gartlehner et al., 2025 [28] | Study within 6 ongoing reviews (9,341 data elements, 63 studies): Claude extraction verified by a human vs human-only extraction | Accuracy 91.0% vs 89.0%; major errors 2.5% vs 2.7%; a median of 41 minutes saved per study |
| Helms Andersen et al., 2025 [29] | Elicit and ChatGPT against human extraction (30 articles from 3 reviews) | Precision, recall, and F1 of 89% to 92%; recall for review-specific variables only 77% to 80%; confabulations in 4% of data points |
| Motzfeldt Jensen et al., 2025 [30] | ChatGPT-4o on 484 data points from 11 papers | 92.4% accurate, but false data in 5.2% of cases; agreement between sessions fell to 77.2% when information was not reported |
| Clark et al., 2025 [31] | Systematic review of 19 studies of generative AI in evidence synthesis | Incorrect extractions ranged from 4% to 31% (median 14%); evidence does not support use without human oversight |
| Kataoka et al., 2026 [32] | A fully automated GPT-4o and o3 system | Accuracy higher for text variables than numbers (75.3% overall with o3 on an updated-search dataset); cannot yet replace humans for numeric data |
| Fan et al., 2026 [33] | Claude 3.5 Sonnet on 23,069 data cells from 664 trials | 6.6% error rate, mostly misallocation to the wrong field (57.1% of errors) and missed data (23.2%); fewer errors in trials with better CONSORT reporting |
Two cautions run through this work. AI tools also perform worse on numbers and review-specific items, the data that matter most for a meta-analysis: accuracy is lower for numeric variables [32], and recall is lower for review-specific variables [29]. And human reference standards are imperfect too: in one evaluation, the model detected 21 minor errors in the human-led reference standard [34].
What the evidence synthesis organizations say
A 2025 joint position statement from Cochrane, the Campbell Collaboration, JBI, and the Collaboration for Environmental Evidence supports the aims of the RAISE (Responsible use of AI in evidence SynthEsis) recommendations [35]. It says:
AI and automation should be used with human oversight, and authors can use them as long as they can demonstrate they won't compromise the rigor or integrity of the synthesis [35].
Decisions to use AI should be considered and reported as part of protocol development, and authors may need to pilot or calibrate a tool within their own review [35].
Authors should declare AI that makes or suggests judgments, including extraction of bibliographic, numerical, or qualitative data, and report the tool's name, version, and the dates used [35].
PRISMA 2020 item 9 also asks for details of any automation tools, including how the tool was trained and what validation was done to understand the risk of incorrect extractions [7]. A practical pattern, proposed by Helms Andersen and colleagues, is to let the AI act as the second extractor while a human reconciles its discrepancies with the first human extractor [29]. Whatever you choose, state it in your protocol and keep a log of what the tool suggested.
Adapting the form to your review type
Non-randomized studies of interventions: extract the adjusted estimates and the variables adjusted for [6], and the information your risk of bias tool needs. See our guide to ROBINS-I V2.
Prognostic factor studies: add the items the QUIPS tool assesses; see our QUIPS guide. For reviews of prediction models, the CHARMS checklist defines 11 domains for data extraction and critical appraisal [36].
Diagnostic accuracy studies: add the test, reference standard, threshold, and accuracy data for each index test, and the items your QUADAS assessment needs; see our QUADAS-2 guide.
JBI reviews: extraction uses the standardized JBI form, which must be appended to the review; if you use a different form, briefly describe it and justify it [4].
Scoping reviews: use a charting form built around your population, concept, and context; see our data charting guide.
Data extraction form example: one completed record
Below is part of a completed form for one study in a hypothetical review of nurse-led self-management programs for adults with type 2 diabetes. The outcome is HbA1c at 6 months. Each entry records what the report says and where.
Extract from a completed data extraction form (hypothetical trial and data)
| Item | Entry (as reported) | Source |
|---|---|---|
| Study ID / report ID | Trial A 2024 / Report 1 (main paper); Report 2 (registry record) | — |
| Form version | v1.2, 3 March 2026 | — |
| Design | Parallel randomized trial, 2 arms, 4 centers | p. 3, Methods |
| Participants | 100 adults with type 2 diabetes and HbA1c ≥ 7.5%; mean age 58 years; 46% women | p. 4, Table 1 |
| Intervention | Six nurse-led group sessions over 12 weeks, 90 minutes each, in primary care clinics | p. 3; TIDieR items 4 to 8 |
| Comparator | Usual care (one leaflet) | p. 3 |
| Outcome | HbA1c (%), laboratory assay; final value at 6 months; mean and spread by group; lower is better | p. 5 |
| Randomized / analyzed | Intervention 50 / 48; usual care 50 / 46 | Figure 1 (flow diagram) |
| Intervention result | Mean 7.2 (95% CI 6.9 to 7.5), n = 48 | Table 2 |
| Usual care result | Mean 7.6 (SE 0.15), n = 46 | Table 2 |
| Funding | Public research grant; authors report no conflicts | p. 9 |
| Notes | Registry lists HbA1c at 12 months too; not in the paper. Email to authors sent 12 March 2026. | Report 2 |
The conversions are done in a separate, documented step, following chapter 6 of the Handbook [6]:
Intervention group: the 95% CI is 0.6 wide and N = 48, fewer than 60, so use the t value for 47 degrees of freedom (2.012): SD = √48 × 0.6 / (2 × 2.012) = 1.03. Dividing by 3.92 instead would give 1.06.
Usual care group: the SE belongs to a single group, so SD = 0.15 × √46 = 1.02.
At consensus, suppose one extractor had entered 0.15 as the usual care SD. That is the SE-for-SD error the Handbook warns about [6]; comparing the two independent extractions catches it before it makes the study look far more precise than it is.
How to report data extraction in your methods (PRISMA 2020)
PRISMA 2020 items that cover data extraction [3]
| Item | What to report |
|---|---|
| 9: Data collection process | How many reviewers collected data from each report, whether they worked independently, any processes for obtaining or confirming data from study investigators, and details of any automation tools |
| 10a: Data items (outcomes) | All outcomes for which data were sought, defined, and whether all compatible results were sought; if not, how results were chosen |
| 10b: Data items (other variables) | All other variables sought, such as participant and intervention characteristics and funding sources, and any assumptions made about missing or unclear information |
| 13b: Synthesis methods | Methods used to prepare data for synthesis, such as handling missing summary statistics or data conversions |
| 17: Study characteristics | Cite each included study and present its characteristics |
| 19: Results of individual studies | For each study and outcome: summary statistics for each group and an effect estimate with its precision |
| 27: Availability of materials | Whether the template data collection forms, extracted data, analysis data, and code are publicly available, and where |
The PRISMA 2020 explanation and elaboration adds detail for item 9: say how disagreements between data collectors were resolved, how non-English articles were translated, which software was used for figures, and what rules you used to choose data from multiple reports of the same study. For item 10b, a brief summary can be enough if you make the data collection and dictionary forms available, for example as additional files or in a public repository [7]. Sharing the extracted data is encouraged when it is legal and ethical [1].
Example methods paragraph (hypothetical review)
Two reviewers independently extracted data from each included study using a standardized form in Covidence, which was piloted on three studies and revised before full extraction (form and data dictionary in Supplementary File 2).
We extracted study design, setting, participant characteristics, intervention details using the TIDieR items, comparators, outcome definitions and time points, results for each group, funding, and conflicts of interest. When a study reported HbA1c at several time points, we used the value closest to 6 months.
Disagreements were resolved by discussion or, when needed, by a third reviewer. We contacted study authors by email for missing or unclear data (two reminders over four weeks) and recorded all replies.
Standard deviations were calculated from standard errors or confidence intervals following the Cochrane Handbook, using the t distribution for groups of fewer than 60. Where only medians were reported, means and SDs were estimated using the methods of Luo et al. and Wan et al., and these studies were excluded in a sensitivity analysis.
For the whole sequence, from protocol and search to synthesis and reporting, see our guide to how to do a systematic review, and for the analysis that follows extraction, our guide to how to do a meta-analysis.
Common data extraction mistakes (and how to avoid them)
Treating a standard error as a standard deviation [6].
Converting as you extract instead of recording the numbers as reported and converting later [1].
Using the SE of a mean difference in the single-group SE formula [6].
Estimating SDs from ranges, or from IQRs of skewed data [6].
Wrong numbers of patients, wrong means or standard deviations, and the wrong sign for the effect estimate, the common errors in meta-analyses of standardized mean differences [16].
Counting a study twice because its reports weren't linked [1].
Choosing among several eligible results after seeing them, instead of following a rule in the protocol [1,7].
Assuming no mention of harms means no harms [1].
Skipping the pilot, or changing the form mid-extraction without a new version [1].
Letting one person extract outcome data unchecked [2].
Accepting AI output without human verification, or not reporting its use [35].
Getting help with data extraction
If you need a second independent extractor, help designing and piloting your form, or support converting awkwardly reported results for a meta-analysis, see our systematic review service and meta-analysis service. Our PhD-led reviewers work alongside you, and you keep ownership of your question and conclusions.
Frequently asked questions
What is a data extraction form in a systematic review?
A structured form for recording the same information from every included study: record details, eligibility, study methods, participants, interventions, outcomes, results, funding, and conflicts of interest. It is also the record of where each number came from.
What should a data extraction form include?
Following the Cochrane Handbook checklist: the extractor, date, and study and report IDs; eligibility; study methods; participants; interventions and comparators; the five elements of each outcome; results for each group, outcome, and time point; funding and conflicts of interest; and the study authors' conclusions.
Do two people need to extract data for a systematic review?
For outcome data, yes. Cochrane's MECIR standards make independent duplicate extraction of outcome data mandatory and duplicate extraction of study characteristics highly desirable. Single extraction with verification produced more errors than double extraction in a comparative study.
How do you pilot a data extraction form?
Have several people extract data from a few included studies, draft the characteristics of included studies table and a risk of bias assessment from them, fix unclear or missing items, and give the revised form a new version number before full extraction.
What if a study reports a median instead of a mean?
Record the median, IQR, or range as reported. You can estimate the mean and SD using the Luo, Wan, and Shi methods, but they assume roughly normal data; medians often signal skew, so check skewness and test the estimates in a sensitivity analysis.
How do I get the standard deviation from a standard error or confidence interval?
SD = SE × √N for a single group's mean. From a 95% CI of a group mean, SD = √N × (upper − lower) / 3.92, replacing 3.92 with twice the t value when the group has fewer than 60 participants (and, when in doubt, for groups of 60 to 100).
Can I use ChatGPT or other AI for data extraction?
Only with human oversight. Recent studies report accuracy from about 69% to 96%, lower for numbers and review-specific variables, and some invented data. Cochrane, Campbell, JBI, and CEE say AI use should be planned in the protocol, validated, and reported with the tool's name, version, and dates.
What is the difference between data extraction and data charting?
Both record data from included sources on a standard form. Charting is the term scoping reviews traditionally use, and it collects broader, more descriptive data than the extraction done for effectiveness reviews and meta-analyses.
What does PRISMA 2020 require about data extraction?
Item 9 covers the data collection process (how many reviewers, independence, contacting investigators, and automation tools), items 10a and 10b the data items, item 13b any conversions, and item 27 whether your forms and extracted data are publicly available.
References
- Li T, Higgins JPT, Deeks JJ. Chapter 5: collecting data (last updated October 2019). In: Higgins JPT, Thomas J, Chandler J, Cumpston M, Li T, Page MJ, et al, editors. Cochrane handbook for systematic reviews of interventions. Version 6.5. Cochrane; 2024 [cited 2026 Nov 14]. Available from: https://training.cochrane.org/handbook/current/chapter-05
- Higgins JPT, Lasserson T, Thomas J, Flemyng E, Churchill R. Methodological expectations of Cochrane intervention reviews (MECIR), version August 2023: collecting data from included studies (C43-C51) [Internet]. London: Cochrane; 2023 [cited 2026 Nov 14]. Available from: https://www.cochrane.org/authors/handbooks-and-manuals/mecir-manual/standards-conduct-new-cochrane-intervention-reviews-c1-c75/performing-review-c24-c75/collecting-data-included-studies-c43-c51
- Page MJ, McKenzie JE, Bossuyt PM, Boutron I, Hoffmann TC, Mulrow CD, et al. The PRISMA 2020 statement: an updated guideline for reporting systematic reviews. BMJ. 2021;372:n71. doi:10.1136/bmj.n71
- Tufanaru C, Munn Z, Aromataris E, Campbell J, Hopp L. Chapter 4: systematic reviews of effectiveness. In: Aromataris E, Lockwood C, Porritt K, Pilla B, Jordan Z, editors. JBI manual for evidence synthesis. Adelaide: JBI; 2024. doi:10.46658/JBIMES-24-03
- Hoffmann TC, Glasziou PP, Boutron I, Milne R, Perera R, Moher D, et al. Better reporting of interventions: template for intervention description and replication (TIDieR) checklist and guide. BMJ. 2014;348:g1687. doi:10.1136/bmj.g1687
- Higgins JPT, Li T, Deeks JJ, editors. Chapter 6: choosing effect measures and computing estimates of effect (last updated August 2023). In: Higgins JPT, Thomas J, Chandler J, Cumpston M, Li T, Page MJ, et al, editors. Cochrane handbook for systematic reviews of interventions. Version 6.5. Cochrane; 2024 [cited 2026 Nov 14]. Available from: https://training.cochrane.org/handbook/current/chapter-06
- Page MJ, Moher D, Bossuyt PM, Boutron I, Hoffmann TC, Mulrow CD, et al. PRISMA 2020 explanation and elaboration: updated guidance and exemplars for reporting systematic reviews. BMJ. 2021;372:n160. doi:10.1136/bmj.n160
- Mathes T, Klaßen P, Pieper D. Frequency of data extraction errors and methods to increase data extraction quality: a methodological review. BMC Med Res Methodol. 2017;17(1):152. doi:10.1186/s12874-017-0431-4
- Wan X, Wang W, Liu J, Tong T. Estimating the sample mean and standard deviation from the sample size, median, range and/or interquartile range. BMC Med Res Methodol. 2014;14:135. doi:10.1186/1471-2288-14-135
- Luo D, Wan X, Liu J, Tong T. Optimally estimating the sample mean from the sample size, median, mid-range, and/or mid-quartile range. Stat Methods Med Res. 2018;27(6):1785-805. doi:10.1177/0962280216669183
- Shi J, Luo D, Weng H, Zeng XT, Lin L, Chu H, et al. Optimally estimating the sample standard deviation from the five-number summary. Res Synth Methods. 2020;11(5):641-54. doi:10.1002/jrsm.1429
- Weir CJ, Butcher I, Assi V, Lewis SC, Murray GD, Langhorne P, et al. Dealing with missing standard deviation and mean values in meta-analysis of continuous outcomes: a systematic review. BMC Med Res Methodol. 2018;18(1):25. doi:10.1186/s12874-018-0483-0
- Horton J, Vandermeer B, Hartling L, Tjosvold L, Klassen TP, Buscemi N. Systematic review data extraction: cross-sectional study showed that experience did not increase accuracy. J Clin Epidemiol. 2010;63(3):289-98. doi:10.1016/j.jclinepi.2009.04.007
- Büchter RB, Weise A, Pieper D. Development, testing and use of data extraction forms in systematic reviews: a review of methodological guidance. BMC Med Res Methodol. 2020;20(1):259. doi:10.1186/s12874-020-01143-3
- Buscemi N, Hartling L, Vandermeer B, Tjosvold L, Klassen TP. Single data extraction generated more errors than double data extraction in systematic reviews. J Clin Epidemiol. 2006;59(7):697-703. doi:10.1016/j.jclinepi.2005.11.010
- Gøtzsche PC, Hróbjartsson A, Marić K, Tendal B. Data extraction errors in meta-analyses that use standardized mean differences. JAMA. 2007;298(4):430-7. doi:10.1001/jama.298.4.430
- Xu C, Yu T, Furuya-Kanamori L, Lin L, Zorzela L, Zhou X, et al. Validity of data extraction in evidence synthesis practice of adverse events: reproducibility study. BMJ. 2022;377:e069155. doi:10.1136/bmj-2021-069155
- Lee S, Lee KH, Park KM, Park SJ, Kim WJ, Lee J, et al. Impact of data extraction errors in meta-analyses on the association between depression and peripheral inflammatory biomarkers: an umbrella review. Psychol Med. 2023;53(5):2017-30. doi:10.1017/S0033291721003767
- Jelicic Kadic A, Vucic K, Dosenovic S, Sapunar D, Puljak L. Extracting data from figures with software was faster, with higher interrater reliability than manual extraction. J Clin Epidemiol. 2016;74:119-23. doi:10.1016/j.jclinepi.2016.01.002
- Vucic K, Jelicic Kadic A, Puljak L. Survey of Cochrane protocols found methods for data extraction from figures not mentioned or unclear. J Clin Epidemiol. 2015;68(10):1161-4. doi:10.1016/j.jclinepi.2014.11.016
- Guyot P, Ades AE, Ouwens MJNM, Welton NJ. Enhanced secondary analysis of survival data: reconstructing the data from published Kaplan-Meier survival curves. BMC Med Res Methodol. 2012;12:9. doi:10.1186/1471-2288-12-9
- Liu N, Zhou Y, Lee JJ. IPDfromKM: reconstruct individual patient data from published Kaplan-Meier survival curves. BMC Med Res Methodol. 2021;21(1):111. doi:10.1186/s12874-021-01308-8
- Covidence. How to decide when to use Extraction 1 vs Extraction 2 [Internet]. Melbourne: Covidence; 2026 [cited 2026 Nov 14]. Available from: https://support.covidence.org/help/which-version-of-data-extraction-should-i-use
- Covidence. How to do single reviewer extraction in Extraction 1 [Internet]. Melbourne: Covidence; 2026 [cited 2026 Nov 14]. Available from: https://support.covidence.org/help/how-to-do-single-reviewer-extraction-in-extraction-1
- Covidence. AI feature: extraction suggestions [Internet]. Melbourne: Covidence; 2026 [cited 2026 Nov 14]. Available from: https://support.covidence.org/help/ai-feature-extraction-suggestions
- Gartlehner G, Kahwati L, Hilscher R, Thomas I, Kugley S, Crotty K, et al. Data extraction for evidence synthesis using a large language model: a proof-of-concept study. Res Synth Methods. 2024;15(4):576-89. doi:10.1002/jrsm.1710
- Konet A, Thomas I, Gartlehner G, Kahwati L, Hilscher R, Kugley S, et al. Performance of two large language models for data extraction in evidence synthesis. Res Synth Methods. 2024;15(5):818-24. doi:10.1002/jrsm.1732
- Gartlehner G, Kugley S, Crotty K, Viswanathan M, Dobrescu A, Nussbaumer-Streit B, et al. Artificial intelligence-assisted data extraction with a large language model: a study within reviews. Ann Intern Med. 2025;178(12):1763-71. doi:10.7326/ANNALS-25-00739
- Helms Andersen T, Marcussen TM, Termannsen AD, Lawaetz TWH, Nørgaard O. Using artificial intelligence tools as second reviewers for data extraction in systematic reviews: a performance comparison of two AI tools against human reviewers. Cochrane Evid Synth Methods. 2025;3(4):e70036. doi:10.1002/cesm.70036
- Motzfeldt Jensen M, Brix Danielsen M, Riis J, Assifuah Kristjansen K, Andersen S, Okubo Y, et al. ChatGPT-4o can serve as the second rater for data extraction in systematic reviews. PLoS One. 2025;20(1):e0313401. doi:10.1371/journal.pone.0313401
- Clark J, Barton B, Albarqouni L, Byambasuren O, Jowsey T, Keogh J, et al. Generative artificial intelligence use in evidence synthesis: a systematic review. Res Synth Methods. 2025;16(4):601-19. doi:10.1017/rsm.2025.16
- Kataoka Y, Takayama T, Yoshimura K, So R, Tsujimoto Y, Yamagishi Y, et al. Automating the data extraction process for systematic reviews using GPT-4o and o3. Res Synth Methods. 2026;17(1):42-62. doi:10.1017/rsm.2025.10030
- Fan S, Chen M, Doi SA, Ye Z, Peng Z, Tian Y, et al. Evaluating data extraction error by a large language model from randomised controlled trials: a large-scale empirical study. BMJ Evid Based Med. 2026;31(5):324-31. doi:10.1136/bmjebm-2025-114044
- Gartlehner G, Kahwati L, Nussbaumer-Streit B, Crotty K, Hilscher R, Kugley S, et al. From promise to practice: challenges and pitfalls in the evaluation of large language models for data extraction in evidence synthesis. BMJ Evid Based Med. 2025;30(6):385-9. doi:10.1136/bmjebm-2024-113199
- Flemyng E, Noel-Storr A, Macura B, Gartlehner G, Thomas J, Meerpohl JJ, et al. Position statement on artificial intelligence (AI) use in evidence synthesis across Cochrane, the Campbell Collaboration, JBI, and the Collaboration for Environmental Evidence 2025. JBI Evid Synth. 2025;23(11):2162-6. doi:10.11124/JBIES-25-00480
- Moons KGM, de Groot JAH, Bouwmeester W, Vergouwe Y, Mallett S, Altman DG, et al. Critical appraisal and data extraction for systematic reviews of prediction modelling studies: the CHARMS checklist. PLoS Med. 2014;11(10):e1001744. doi:10.1371/journal.pmed.1001744

James has 7 years of experience in epidemiology, clinical research, public health, and evidence-based healthcare. He supports researchers and healthcare professionals through the whole evidence synthesis process, from refining a question and planning a protocol to reporting the results. Areas of expertise Systematic…