
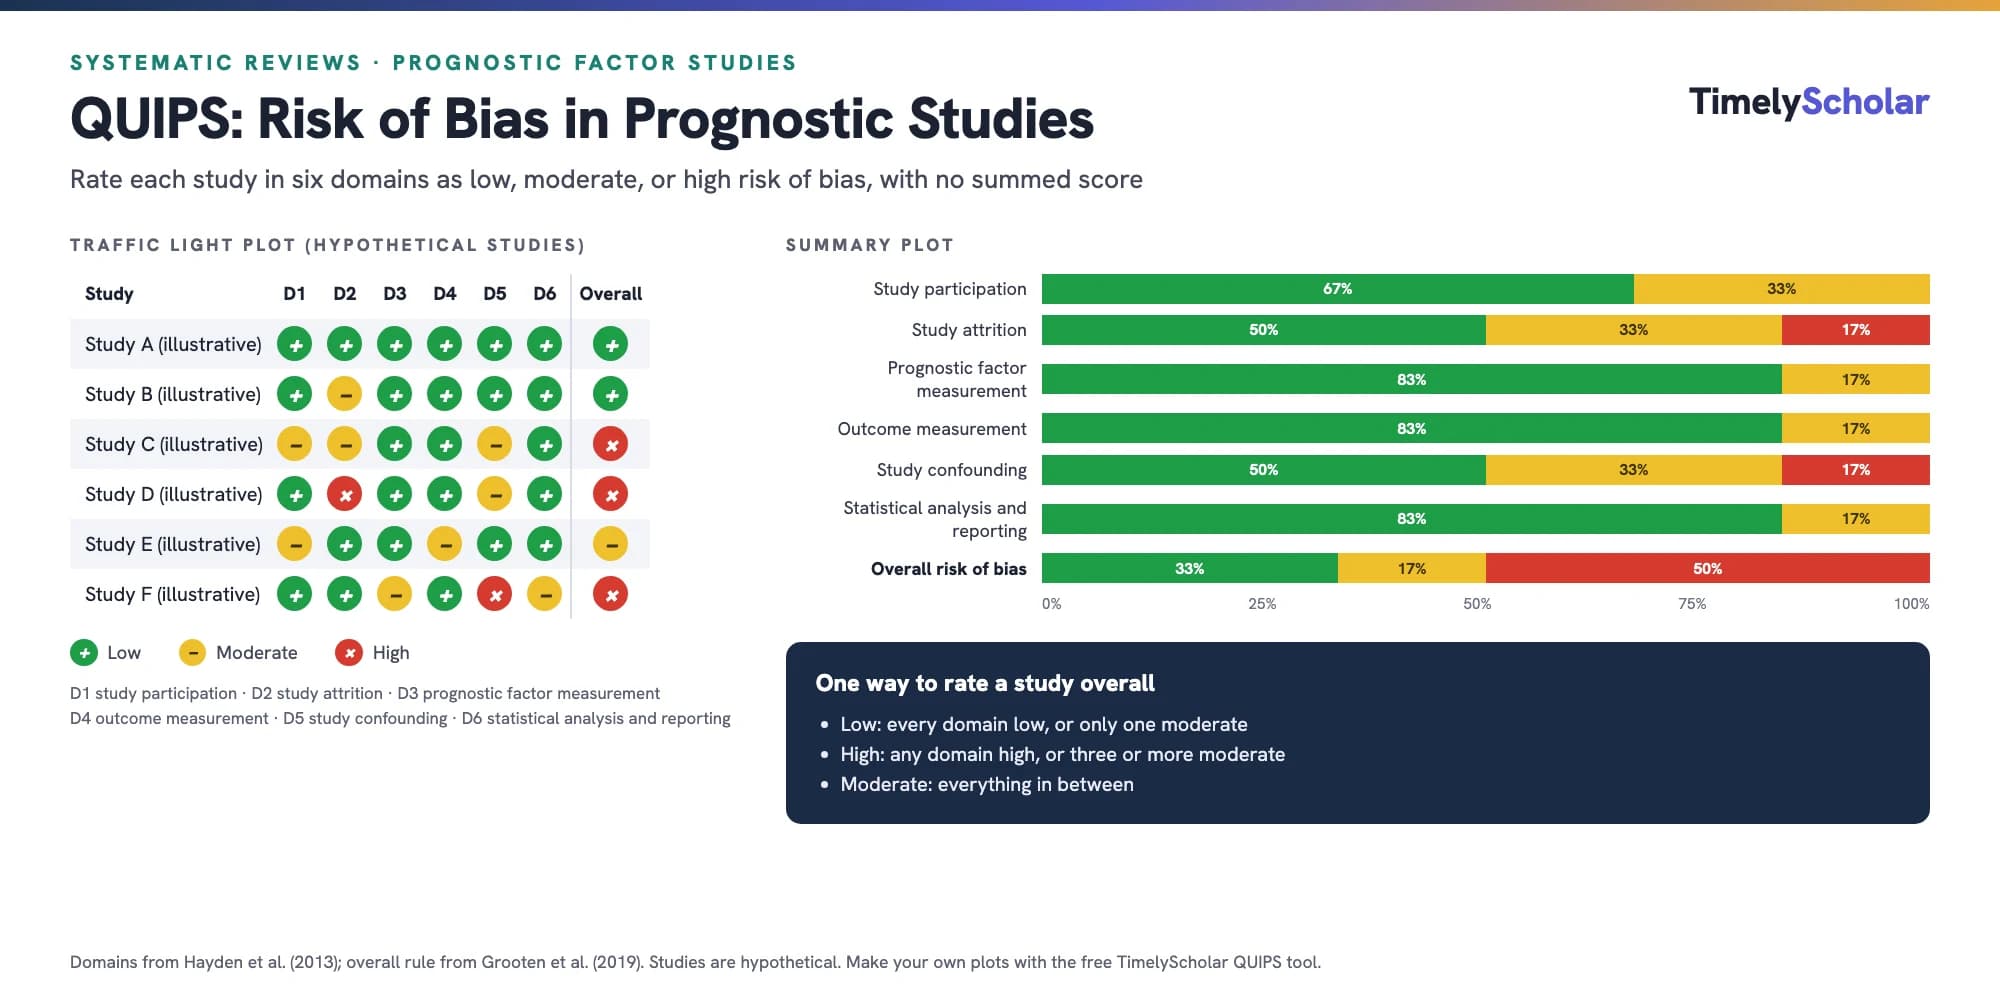
The QUIPS tool (Quality In Prognosis Studies) assesses risk of bias in prognostic factor studies, which ask whether a characteristic such as a symptom, biomarker, or score is associated with a later outcome [1]. It has six domains: study participation, study attrition, prognostic factor measurement, outcome measurement, study confounding, and statistical analysis and reporting. Reviewers work through each domain's prompting items and rate it low, moderate, or high risk of bias. QUIPS has no official score, so if you need an overall rating, pre-specify a rule, such as the one used by Grooten et al.: low if every domain is low or only one is moderate, high if any domain is high or three or more are moderate [2]. QUIPS is for prognostic factors; studies that develop or validate prediction models need PROBAST instead [3].
Working on a systematic review? A PhD-led reviewer can help at any stage. Get a free quote →
What is the QUIPS tool?
QUIPS stands for Quality In Prognosis Studies. A prognostic factor study follows people who share a health condition and asks whether a characteristic measured at the start (the prognostic factor) is associated with an outcome later on, for example, whether high pain catastrophizing at baseline predicts disability a year later. Flaws in who was recruited, who was lost to follow-up, how the factor and outcome were measured, and how the data were analyzed can all make an association look stronger or weaker than it really is. QUIPS gives reviewers a structured way to judge those flaws study by study.
The tool grew out of a 2006 review of how prognosis studies were being appraised, which identified six areas that matter most [4]. Hayden et al. published the refined QUIPS tool in 2013 [1]. A working group of epidemiologists, statisticians, and clinicians developed it, and before it was finalized, 43 review groups working on prognosis in other topic areas used earlier versions and gave feedback. With those versions, median completion time was 20 minutes per study, and the nine review teams that reported interrater agreement found kappa values from 0.56 to 0.82 (median 0.75). Later testing of the published tool found lower agreement, as explained below [2]. No newer version has been published, so the 2013 tool is the current one and the paper to cite in your methods.
When should you use QUIPS, and when should you use PROBAST or another tool?
Choose the risk-of-bias tool by the question your review asks, not by the design of the included studies. Many prognosis reviews include cohort studies, but so do reviews of interventions and exposures, and they need different tools.
| Your review question | Tool | What it assesses |
|---|---|---|
| Is a single characteristic associated with a later outcome? (prognostic factor) | QUIPS (2013) | Six domains, from study participation to statistical analysis and reporting |
| How well does a multivariable model predict an outcome? (prediction model development or validation) | PROBAST (2019) or PROBAST+AI (2025) | Participants, predictors, outcome, and analysis, plus applicability |
| How accurate is a test for diagnosing a condition? | QUADAS-2 or QUADAS-3 | QUADAS-2: patient selection, index test, reference standard, and flow and timing; QUADAS-3: participants, index test, target condition, and analysis |
| What is the effect of an intervention in non-randomized studies? | ROBINS-I | Bias from confounding through to selection of the reported result |
| What is the causal effect of an exposure? | ROBINS-E | Bias in observational studies of exposures |
| What is the effect of an intervention in randomized trials? | RoB 2 | Five domains of trial bias |
The most common mix-up is between QUIPS and PROBAST. QUIPS judges the evidence about one prognostic factor at a time. PROBAST is for studies that develop, validate, or update a multivariable prediction model, a combination of predictors that estimates an individual's risk [3]. Its 2025 update, PROBAST+AI, also covers models built with machine learning [5]. If your included studies report a risk score or model performance (discrimination, calibration), you need PROBAST, not QUIPS.
For the other question types, see our guide to QUADAS-2 for diagnostic accuracy studies, our guide to ROBINS-I V2 for non-randomized studies of interventions, and our free ROBINS-I, ROBINS-E, and RoB 2 tools.
What are the six QUIPS domains and prompting items?
Each domain has a short list of prompting items: questions that guide your judgment but are not scored. The table summarizes them; use the full wording from Hayden et al. [1] in your assessment.
| Domain | What the prompting items ask | Example of high risk of bias |
|---|---|---|
| 1. Study participation | Did enough eligible people take part? Are the source population, baseline sample, sampling frame and recruitment, period and place of recruitment, and inclusion and exclusion criteria described? | Only 40% of eligible patients agreed to take part, and those who declined are not described. |
| 2. Study attrition | Was follow-up adequate? Were attempts made to collect data on people who dropped out, and are their reasons and characteristics reported? Do completers differ from those lost? | A third of participants were lost to follow-up, and they had worse symptoms at baseline than those who stayed. |
| 3. Prognostic factor measurement | Is the factor clearly defined and measured validly, reliably, and in the same way for everyone? Are continuous values or appropriate cut points used? Are enough data complete, with appropriate handling of missing data? | A biomarker was dichotomized at the cut point that gave the strongest association in this sample. |
| 4. Outcome measurement | Is the outcome clearly defined and measured validly, reliably, and in the same way for all participants? | The outcome was taken from records for some participants and from interviews for others. |
| 5. Study confounding | Were the important confounders measured with clear definitions and valid, reliable methods, the same way for everyone, and accounted for in the design or analysis? | An unadjusted association is reported although known confounders such as age and baseline severity were available. |
| 6. Statistical analysis and reporting | Is there enough information to judge the analysis? Are the model-building strategy and the statistical model appropriate? Is there no selective reporting of results? | Twelve candidate factors were measured, but only the three significant ones are reported. |
Agreement varies by domain. Grooten et al. found the lowest agreement for study participation, prognostic factor measurement, outcome measurement, and statistical analysis and reporting, and the highest for study attrition [2]. Two domains need particular care. In study confounding, what counts as an important confounder depends on your review question, so list the core confounders in your protocol before you start. In statistical analysis and reporting, decide in advance where to record a problem that could fit two domains. Grooten et al. describe a paper that reported an odds ratio without saying whether it was adjusted: one rater marked it high risk under statistical analysis and reporting, the other under confounding [2]. Agreeing on rules like this in advance helps two reviewers rate consistently.
How do you use the QUIPS tool step by step?
- Define what you are rating. Risk of bias can differ between prognostic factors and outcomes within the same study [2], so rate each prognostic factor-outcome association your review analyzes, not the paper as a whole. If a study reports several factors, record a separate row for each one you extract.
- Tailor the prompting items in your protocol. Set your thresholds before screening: what counts as adequate participation and follow-up (Grooten et al. used at least 67% for both [2]), which confounders must be accounted for, which measurement methods are acceptable, and that cut points must not be chosen from the data.
- Pilot the tool. Rate a handful of studies together and compare. Grooten et al. piloted QUIPS on five papers that were not in their review before rating the included studies [2].
- Rate independently, in duplicate. Two reviewers work through every prompting item and rate each domain low, moderate, or high, then resolve disagreements by discussion or with a third reviewer. Reporting agreement before consensus, for example with Cohen's kappa, is optional but strengthens your methods.
- Record a reason for every judgment. A short note or a quote from the paper for each domain makes consensus faster and gives you the supplementary table journals ask for.
- Apply your overall rating rule if you use one, exactly as written in the protocol.
Expect some disagreement at first. During development, Hayden et al. found that reviewers sometimes struggled to combine the prompting items into a domain judgment, and they addressed it with more detailed guidance and examples [1]. Grooten et al. found only weak agreement overall (the raters agreed on 61% of domain ratings, quadratic weighted kappa 0.48), which improved from the first round of rating to the second as the raters agreed on definitions [2].
Is there a QUIPS score or an overall rating?
No. QUIPS rates each domain separately and does not define a total score or an overall rating. Summing items into a quality score is not recommended, because it gives equal weight to problems of very different importance [2]. Many reviews still need to group studies, for example to run a sensitivity analysis, so they pre-specify a rule. One published rule comes from Grooten et al. [2]:
- Low risk of bias if all six domains are low, or at most one is moderate.
- High risk of bias if any domain is high, or three or more are moderate.
- Moderate risk of bias for everything in between.
Whatever rule you use, write it in your protocol, apply it consistently, and state it in your methods section. Our QUIPS tool applies the Grooten rule by default and lets you override the suggestion for any study.
Worked example: rating a cohort study with QUIPS
Question: Is high pain catastrophizing at baseline associated with disability 12 months later in adults with chronic low back pain?
Study participation: consecutive patients from three primary care clinics; 71% of eligible patients enrolled; baseline characteristics described → low.
Study attrition: 78% followed up at 12 months; completers and dropouts had similar age and baseline pain, but reasons for dropout are not reported → moderate.
Prognostic factor measurement: a validated catastrophizing questionnaire, analyzed as a continuous score → low.
Outcome measurement: a validated disability questionnaire, completed the same way by everyone → low.
Study confounding: adjusted for baseline pain and disability, but not for depression, which the review protocol listed as a core confounder → moderate.
Statistical analysis and reporting: the regression model is described and every factor named in the methods is reported → low.
Overall (Grooten rule): two moderate domains and none high → moderate risk of bias.
Notice that the judgment is about this one association. If the same study also reported sleep quality as a prognostic factor but measured it with an unvalidated single question, that second association would get a different rating for domain 3.
How do you present QUIPS results?
Most reviews report QUIPS in a table with one row per study (or per prognostic factor-outcome association) and a column for each of the six domains, with the reasons in a supplementary file. Add a traffic light plot of every rating and a summary plot showing the proportion of studies at low, moderate, and high risk in each domain. Our QUIPS tool draws both and exports PNG, SVG, and CSV files.
Then use the ratings in your synthesis. Common approaches are a sensitivity analysis that drops studies at high risk of bias (see our leave-one-out sensitivity analysis tool), a subgroup analysis by risk of bias, or ordering studies by risk of bias in the forest plot. Our guide to meta-analysis covers pooling the estimates themselves.
How does QUIPS feed into GRADE for prognostic factors?
Risk of bias is one of the five reasons to rate down the certainty of evidence in GRADE. For prognostic factor questions, GRADE guidance 28 states that a body of observational evidence starts at high certainty, and the usual domains for rating down (risk of bias, imprecision, inconsistency, indirectness, and publication bias) and for rating up all apply [6]. Your QUIPS ratings are the evidence for the risk-of-bias domain: if most of the weight in a pooled estimate comes from studies at high risk, rate down.
An earlier adaptation of GRADE for prognostic factor reviews, by Huguet et al., adds the phase of investigation to the reasons for rating down [7]. Say which approach you follow. Our GRADE evidence rating tool helps you record each judgment.
How should you report QUIPS in your methods section?
PRISMA 2020 asks you to describe the risk-of-bias methods (item 11) and to present the assessment for each study (item 18) [8]. A methods paragraph should name the tool and cite it, say who rated and how disagreements were settled, give your tailored thresholds and core confounders, and state your overall rating rule.
Two reviewers independently assessed the risk of bias of each prognostic factor-outcome association using the Quality In Prognosis Studies (QUIPS) tool [1]. Before screening, we defined adequate participation and follow-up as at least 67% and listed age, baseline severity, and depression as core confounders. Each domain was rated low, moderate, or high risk of bias, and disagreements were resolved by discussion or by a third reviewer. Studies were rated low risk overall if all domains were low or one was moderate, and high risk if any domain was high or three or more were moderate [2].
Common QUIPS mistakes (and how to avoid them)
- Using QUIPS for prediction model studies. Studies that develop or validate a risk score need PROBAST [3].
- Adding up a score or a percentage of yes answers. Report each domain.
- Rating the paper instead of the association. One study can be low risk for one prognostic factor and high risk for another.
- Skipping the tailoring step. Without agreed thresholds and core confounders, two reviewers will disagree for reasons unrelated to the studies.
- Recording the same problem in two domains, typically confounding and statistical analysis, or in neither.
- Judging reporting instead of conduct without saying so. If a paper doesn't report enough to decide, record that in your reason.
- Not using the ratings in the synthesis, the discussion, or the GRADE assessment.
QUIPS template and table layout
A QUIPS template in Excel or Word needs one row per prognostic factor-outcome association and these columns: study ID, prognostic factor, outcome, a rating and a supporting note for each of the six domains, the overall rating if you use one, and the reviewer's initials. Keep each reviewer's version separate until consensus. Grooten et al. used one spreadsheet per paper and noted that this may have made it harder to rate the evidence for each prognostic factor separately [2], so set up the rows by association from the start. Our QUIPS tool imports and exports this layout as a CSV file.
Getting help with your prognostic factor review
If you would like a second, independent QUIPS reviewer, help setting thresholds and core confounders for your protocol, or support with pooling adjusted estimates and grading the evidence, see our systematic review service and meta-analysis service. Our PhD-led reviewers work alongside you, and you keep ownership of your question and conclusions. For the overall process, start with our guide to how to do a systematic review.
Frequently asked questions
What is the QUIPS tool used for?
QUIPS (Quality In Prognosis Studies) assesses risk of bias in prognostic factor studies, which examine whether a characteristic measured at baseline is associated with a later outcome. It is used in systematic reviews of prognostic factors.
What are the six domains of the QUIPS tool?
Study participation, study attrition, prognostic factor measurement, outcome measurement, study confounding, and statistical analysis and reporting. Each domain is rated low, moderate, or high risk of bias.
How do you score the QUIPS tool?
You don't. QUIPS has no official score. Each domain is rated low, moderate, or high risk of bias using its prompting items. If you need an overall rating, pre-specify a rule, such as the one used by Grooten et al.: low if all domains are low or one is moderate, high if any is high or three or more are moderate.
What is the difference between QUIPS and PROBAST?
QUIPS assesses studies of individual prognostic factors. PROBAST assesses studies that develop, validate, or update multivariable prediction models, and PROBAST+AI (2025) extends it to models built with machine learning.
How do you cite the QUIPS tool?
Cite Hayden JA, van der Windt DA, Cartwright JL, Côté P, Bombardier C. Assessing bias in studies of prognostic factors. Ann Intern Med. 2013;158(4):280-6. If you use an overall rating rule, also cite its source, such as Grooten et al. for the rule described above.
Is QUIPS the latest version?
Yes. The refined QUIPS tool published by Hayden et al. in 2013 is the current version; no revision has been released.
How long does a QUIPS assessment take?
In the tool's development, the median completion time was about 20 minutes per study. Allow longer at first, and pilot the tool on a few studies before rating your included studies.
Should QUIPS be done by two reviewers?
Yes. Two reviewers should rate each study independently and resolve disagreements by discussion or with a third reviewer. Agreement can be modest at first, so agree on thresholds and definitions in advance.
References
- Hayden JA, van der Windt DA, Cartwright JL, Côté P, Bombardier C. Assessing bias in studies of prognostic factors. Ann Intern Med. 2013;158(4):280-6. doi:10.7326/0003-4819-158-4-201302190-00009
- Grooten WJA, Tseli E, Äng BO, Boersma K, Stålnacke BM, Gerdle B, et al. Elaborating on the assessment of the risk of bias in prognostic studies in pain rehabilitation using QUIPS: aspects of interrater agreement. Diagn Progn Res. 2019;3(1):5. doi:10.1186/s41512-019-0050-0
- Wolff RF, Moons KGM, Riley RD, Whiting PF, Westwood M, Collins GS, et al. PROBAST: a tool to assess the risk of bias and applicability of prediction model studies. Ann Intern Med. 2019;170(1):51-8. doi:10.7326/M18-1376
- Hayden JA, Côté P, Bombardier C. Evaluation of the quality of prognosis studies in systematic reviews. Ann Intern Med. 2006;144(6):427-37. doi:10.7326/0003-4819-144-6-200603210-00010
- Moons KGM, Damen JAA, Kaul T, Hooft L, Andaur Navarro C, Dhiman P, et al. PROBAST+AI: an updated quality, risk of bias, and applicability assessment tool for prediction models using regression or artificial intelligence methods. BMJ. 2025;388:e082505. doi:10.1136/bmj-2024-082505
- Foroutan F, Guyatt G, Zuk V, Vandvik PO, Alba AC, Mustafa R, et al. GRADE guidelines 28: use of GRADE for the assessment of evidence about prognostic factors: rating certainty in identification of groups of patients with different absolute risks. J Clin Epidemiol. 2020;121:62-70. doi:10.1016/j.jclinepi.2019.12.023
- Huguet A, Hayden JA, Stinson J, McGrath PJ, Chambers CT, Tougas ME, et al. Judging the quality of evidence in reviews of prognostic factor research: adapting the GRADE framework. Syst Rev. 2013;2(1):71. doi:10.1186/2046-4053-2-71
- Page MJ, McKenzie JE, Bossuyt PM, Boutron I, Hoffmann TC, Mulrow CD, et al. The PRISMA 2020 statement: an updated guideline for reporting systematic reviews. BMJ. 2021;372:n71. doi:10.1136/bmj.n71

Emily brings 12 years of experience in higher education. She provides senior-level oversight for complex research projects, helping teams clarify scope, align research questions with methods, and strengthen the logic and reporting of their work. Areas of expertise Oversight of institutional research and research…