
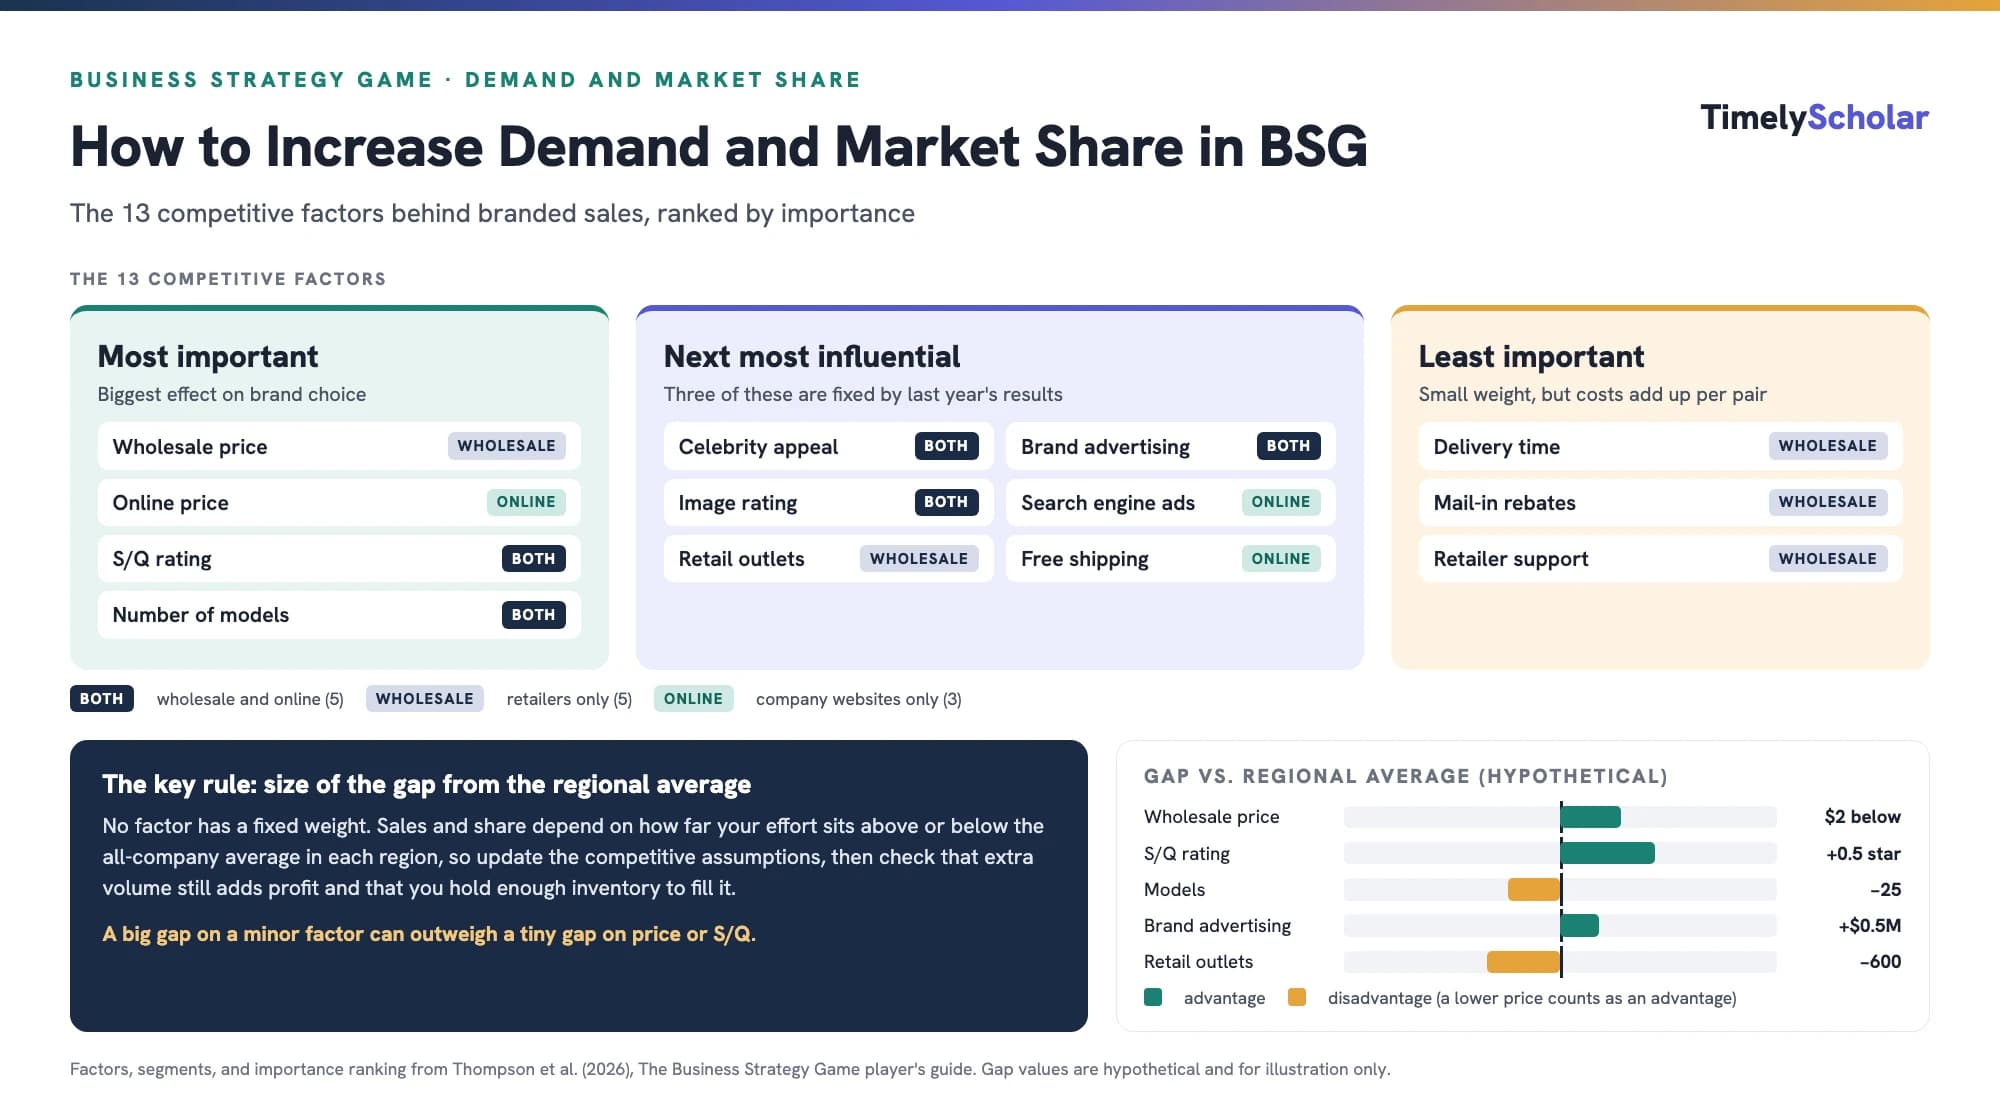
In the Business Strategy Game (BSG), branded demand and market share in each region depend on how your company compares with the all-company regional average on 13 competitive factors. Five affect both wholesale and online sales, five affect only wholesale sales to retailers, and three affect only online sales. The most important are price, S/Q rating, and the number of models. Next come celebrity endorsements, brand advertising, search engine ads, image rating, retail outlets, and free shipping. Delivery time, mail-in rebates, and retailer support matter least. Because the effect of each factor depends on the size of your gap from the regional average, you increase demand by beating the average where it pays most, updating the competitive assumptions so your projections reflect what rivals will do, carrying enough inventory to fill the extra orders, and checking that each gain in volume still adds profit (Thompson et al., 2026).
Playing the Business Strategy Game? Get coaching on strategy and the reports. Get a free quote →
The 13 competitive factors that drive BSG demand and market share
Every year, rival footwear companies compete for branded sales in four regions: North America, Europe-Africa, Asia-Pacific, and Latin America. Each region has two branded segments, wholesale sales to footwear retailers and online sales at company websites, and each segment responds to a different set of competitive factors (Thompson et al., 2026).
The 13 competitive factors in BSG, the segments they affect, and their relative importance (Thompson et al., 2026)
| Competitive factor | Segments affected | Relative importance | Where you set it |
|---|---|---|---|
| Wholesale price to retailers | Wholesale only | Highest | Wholesale Marketing page |
| Online retail price | Online only | Highest | Internet Marketing page |
| S/Q (styling/quality) rating | Both | Highest | Branded Production page and shipping choices |
| Number of models/styles | Both | Highest | Branded Production page and shipping choices |
| Appeal of celebrity endorsers | Both | Second tier | Celebrity contracts won in earlier years |
| Brand advertising | Both | Second tier | Wholesale Marketing page |
| Search engine advertising | Online only | Second tier | Internet Marketing page |
| Image rating (brand reputation) | Both | Second tier | Fixed from last year's results |
| Number of retail outlets | Wholesale only | Second tier | Fixed from last year's results |
| Free shipping | Online only | Second tier | Internet Marketing page |
| Delivery time to retailers | Wholesale only | Lowest | Wholesale Marketing page |
| Mail-in rebates | Wholesale only | Lowest | Wholesale Marketing page |
| Retailer support | Wholesale only | Lowest | Wholesale Marketing page |
Price counts twice in the list, once per channel, because the wholesale price and the online price are separate decisions. Three factors are fixed for the current year: retail outlets, celebrity appeal, and image rating all come from last year's decisions and results. The other ten are under your control this year, which is why a team that starts the year behind on the fixed three needs extra effort on the rest to make up the gap (Thompson et al., 2026).
Your choice among these factors should follow your competitive strategy. A low-cost company leans on price, a differentiator on S/Q, models, and celebrities, and a best-cost company on high S/Q at a moderate price. Our guide to BSG competitive strategies: low-cost, differentiation, and best-cost explains how to pick one, and our BSG industry analysis guide shows why these factors are the industry's key success factors.
The key rule: impact depends on your gap from the regional average
The single most useful idea for increasing demand in BSG is that no factor has a fixed weight. What drives your sales and market share is how far your effort on each factor sits above or below the all-company average in that region. If every company charged the same price in a region, price would have no effect at all, and all sales differences would come from the other 12 factors. Likewise, a large gap on a minor factor, such as delivery time, can move sales more than a tiny gap on a major one, such as price or advertising (Thompson et al., 2026).
Two practical consequences follow. First, a company whose effort matches the regional average on every factor will end up close to the regional average market share, so above-average share requires above-average effort somewhere. Second, a price above the average can be offset by advantages on other factors, such as a higher S/Q rating or more models, but the further your price rises above the average, the harder that becomes. A below-average price works the other way: combined with advantages on other factors, it widens your lead (Thompson et al., 2026).
Gap thinking: Think in gaps, not levels. Before changing any decision, ask how far above or below this year's regional average it will put you, and whether the cost of widening that gap is worth the extra pairs it sells.
How to set wholesale and online prices in BSG
Price is one of the three most powerful factors, and real-world evidence agrees. A meta-analysis of 1,851 price elasticities from 81 studies found an average elasticity of about −2.62: a 1% price cut raised unit sales by roughly 2.6% on average (Bijmolt et al., 2005). That is far stronger than the typical response to advertising, which is discussed below.
Wholesale price
The wholesale price you charge retailers drives the retail price shoppers see, so a wholesale price above the regional average pushes buyers toward cheaper brands. The Wholesale Marketing page updates your projected market share, demand, and operating profit instantly as you try different prices, and Thompson et al. (2026) warn that a lower price can still reduce regional profit when the extra volume does not make up for the lower margin on every pair.
Online price
Online price works the same way in the internet segment, with a maximum of $200 per pair. It also carries a channel-conflict rule. Retailers see your website price as a threat whenever it is less than 40% above your wholesale price, so with a $50 wholesale price, the online price should be at least $70. The further the online price falls below that benchmark, the more retailers drop your brand the following year, which shrinks your retail outlet network (Thompson et al., 2026).
Minimum online price that avoids channel conflict with retailers (40% rule; Thompson et al., 2026)
| Wholesale price | Minimum online price (wholesale × 1.4) |
|---|---|
| $50 | $70.00 |
| $55 | $77.00 |
| $60 | $84.00 |
| $65 | $91.00 |
| $70 | $98.00 |
S/Q rating and number of models
The S/Q rating and the number of models are the other two top-tier factors, and both affect wholesale and online sales. An S/Q rating above the regional average attracts buyers unless the price premium is too high or the brand falls short on other factors (Thompson et al., 2026). Our guide to the BSG S/Q rating and how to increase it covers the five factors behind the rating and what each extra star costs.
A broader product line gives buyers more reasons to choose your brand, but it raises costs. Production run set-up costs per facility climb from $1 million for 50 models to $15 million for 500 models. At a facility making 4 million pairs, that is about $0.25 per pair for 50 models and $3.75 per pair for 500. Production Improvement Option B halves set-up costs, and spreading the same models over a larger facility lowers the cost per pair. More models also tend to raise reject rates and increase the inventory you must hold in each warehouse (Thompson et al., 2026).
Brand advertising, search engine ads, rebates, and free shipping
Four of the factors you control each year are marketing spending decisions. All of them work through the same gap rule: spending above the regional average gives you an edge, and spending below it costs you pairs (Thompson et al., 2026).
Brand advertising affects both channels. Above-average spending in a region raises branded sales there, and it magnifies the effect of your celebrity endorsers.
Search engine advertising affects online sales only. Spending above the regional average draws more shoppers to your website.
Free shipping affects online sales only and has a sizable effect on online volume, but it costs $12.50 per pair, so most teams raise the online price to recover some or all of it. The advantage weakens if that price ends up well above rivals' prices.
Mail-in rebates affect wholesale sales only. They range from $3 to $15 per pair in whole dollars, and buyers respond more than proportionally to larger rebates.
Advertising matters, but real-world returns are modest. A meta-analysis of 751 short-term brand advertising elasticities from 56 studies found an average short-term elasticity of 0.12 and a long-term elasticity of 0.24 (Sethuraman et al., 2011). In other words, doubling advertising raises sales by far less than doubling, so check the projected operating profit after every increase.
Rebates are cheaper than their face value because not every buyer mails in the coupon. The cost per pair rises steeply with the size of the rebate:
Mail-in rebate redemption rates and cost per pair sold (Thompson et al., 2026)
| Rebate offer | Redemption rate | Cost per pair sold |
|---|---|---|
| $3 | 15% | $0.45 |
| $5 | 25% | $1.25 |
| $8 | 40% | $3.20 |
| $10 | 50% | $5.00 |
| $12 | 60% | $7.20 |
| $15 | 90% | $13.50 |
Celebrity endorsements in BSG: appeal indexes and bidding
Celebrity endorsers lift branded sales in both channels in every region, in proportion to their regional appeal index. A celebrity with an index of 90 in a region has twice the sales effect of one with an index of 45 (Thompson et al., 2026). The bidding rules shape how much you should offer:
Highest offer wins. Each celebrity signs with the company offering the most money per year, with a minimum of $500,000 and a maximum of $30 million per year. Contracts last two or three years.
Diminishing returns. Extra celebrities add less once your combined appeal index in a region reaches 200, and nothing once it exceeds 300.
Limit of three per year. You can sign up to three celebrities in a given year, with no limit across years.
Ties. A tie goes to the company whose current endorsers have the lowest combined appeal across all regions, and then to the company with the lower prior-year image rating. That is why Thompson et al. (2026) suggest odd-number offers, which make exact ties less likely.
Timing. A celebrity you win starts endorsing, and you start paying, the year after the winning offer.
Spending cap. You can rank your offers and set a cap on total annual cost, so lower-priority offers drop out once the cap is reached.
Cancellation. You can cancel a contract by paying the current year's fee plus 10% of the annual fee for each remaining year.
Check regional appeal before you bid. A celebrity with high appeal in your strongest regions is worth more to you than one whose appeal lies where you sell little. Research also suggests endorsements work best when the celebrity fits the product: a meta-analysis of 46 studies found strong positive effects for well-matched endorsers and negative effects for poorly matched ones (Knoll & Matthes, 2017).
Retail outlets, delivery time, and retailer support
The number of retailers stocking your brand strongly affects wholesale sales. North America and Europe-Africa each have 20,000 athletic footwear retail outlets, and Asia-Pacific and Latin America each have 10,000 (Thompson et al., 2026). You cannot add retailers instantly. The number willing to carry your brand next year depends on four things (Thompson et al., 2026):
Your branded market share in the region.
Your regional branded S/Q rating.
The number of weeks it takes to deliver retailers' orders.
The merchandising support you give retailers.
A strong prior-year image rating also helps you recruit retailers, and an online price that undercuts the 40% rule drives them away. Thompson et al. (2026) expect a retailer network to build up over several years, so outlet growth is a multi-year investment rather than a quick fix.
Delivery time options and cost per pair (Thompson et al., 2026)
| Delivery time | Cost per pair |
|---|---|
| 4 weeks (retailers consider this satisfactory) | $0.25 |
| 3 weeks | $0.75 |
| 2 weeks | $1.50 |
| 1 week | $3.00 |
Shorter delivery helps retailers avoid running out of popular sizes, so it raises sales and attracts retailers, but it also raises the minimum inventory you must hold. Above-average retailer support raises sales per outlet and the number of outlets willing to carry your brand (Thompson et al., 2026).
Image rating and its effect on demand
Last year's image rating has a moderately strong influence on this year's brand choices, and it helps recruit retailers. The rating is updated at the end of each year from your global average branded S/Q rating, your global market share of total footwear sales (branded plus private-label), and four to five years of corporate social responsibility (Thompson et al., 2026). Market share therefore feeds image, and image feeds next year's demand. Our guide on how to increase EPS, ROE, and image rating in BSG covers each component in detail.
Competitive assumptions and demand projections
Each region has 10 competitive assumptions entries: 7 on the Wholesale Marketing page (covering factors such as S/Q rating, models, brand advertising, and wholesale price) and 3 on the Internet Marketing page (online price, search engine advertising, and free shipping). The first time you open a page, these fields show last year's regional averages. Until you change them, every projection of your sales, market share, revenue, and profit compares your new decisions with rivals' old efforts, which can make the projections wrong by a little or a lot (Thompson et al., 2026).
Update the assumptions before you finalize your marketing decisions.
Assume rivals will, on average, compete harder than last year. Weak performers have reason to improve, and strong performers rarely stand still.
Try a likely case and a worst case, and compare the projected outcomes.
Check whether you are ahead or behind on the three fixed factors (retail outlets, celebrity appeal, and image). If you are behind, plan more effort on the other factors.
Remember that the online projections also rely on the S/Q, model, and advertising assumptions entered on the Wholesale Marketing page.
Err on the side of tougher rivals: Overestimating rivals is the safer mistake. If you sell more than projected, you can fill the extra orders as long as you hold surplus inventory; if you underestimate rivals, you lose sales and are left with unsold pairs (Thompson et al., 2026).
For a walkthrough of the first decision round, see our BSG Year 11 strategy guide.
Using the Competitive Intelligence Report
After each decision round, the Competitive Intelligence Report shows exactly where you won and lost. It has three views: Comparative Competitive Efforts (every company's effort on all 13 factors, plus unit sales and market share, by region), Regional Average Competitive Efforts (the all-company averages for every year so far), and Time Series Competitive Efforts (any one rival's moves over time). Thompson et al. (2026) treat it as the most reliable guide to competing in your own industry, more so than tips from other classes, where rivals behaved differently.
Use it to find the factors where you are furthest below average, decide which are cheapest to fix, and spot the trend in each average so you can set realistic competitive assumptions for next year. The report is also the raw material for a clear-eyed internal analysis of your company's strengths and weaknesses.
Regional demand growth and the online share of sales
Demand grows at different rates in each region, so the same effort earns more pairs where the market is growing faster. Actual growth falls somewhere within each range, varies by year, and assumes companies keep prices, quality, and marketing near Year 10 levels (Thompson et al., 2026).
Projected annual growth in buyer demand by region (Thompson et al., 2026)
| Region | Branded, Years 11–15 | Branded, Years 16–20 | Private-label, Years 11–15 | Private-label, Years 16–20 |
|---|---|---|---|---|
| North America | 5%–7% | 3%–5% | 10%–12% | 8%–10% |
| Europe-Africa | 5%–7% | 3%–5% | 10%–12% | 8%–10% |
| Asia-Pacific | 9%–11% | 7%–9% | 12%–14% | 10%–12% |
| Latin America | 9%–11% | 7%–9% | 12%–14% | 10%–12% |
Online sales were 15% of branded sales in every region in Year 10 and are projected to rise by 1 percentage point a year, reaching 25% by Year 20 (Thompson et al., 2026). Your online price, search ads, and free shipping therefore matter a little more every year. Updated demand forecasts for the next three years appear in the Footwear Industry Report after each round.
Inventory and delivery: do not lose the demand you create
Extra demand is worthless if the warehouse runs short. Each regional warehouse must hold a required minimum inventory, which ranges from 1% of projected sales (4-week delivery, 50 models) to 15% (1-week delivery, 500 models). You cannot dip into it to fill orders, so a projected shortfall means lost sales, and buyers may switch to rivals. Fix a shortfall by shipping more pairs to the region, producing more, clearing less old inventory, or easing marketing effort in that region (Thompson et al., 2026).
Holding too much is costly too. Unsold branded pairs lose 0.3 stars of S/Q rating when they are carried into the next year, and storage costs $1.00 per pair on surplus pairs compared with $0.50 on required inventory (Thompson et al., 2026). The aim is a modest projected surplus in each warehouse, enough to absorb better-than-expected demand without a large carryover.
Private-label sales and total market share
Private-label pairs do not raise branded demand, but they count toward your global market share of total footwear sales, which is one of the three components of the image rating (Thompson et al., 2026). They also fill spare capacity and spread fixed costs over more pairs, as long as the price covers direct costs.
Each company makes one offer per region, with a minimum of 100,000 pairs.
Chain retailers accept offers from the lowest price upward until demand is met, and a tie goes to the company with the higher prior-year image rating.
An offer is only considered if it is at least $10.00 below the upcoming year's average wholesale price for branded footwear in that region.
Private-label pairs must meet an S/Q rating 1 star below the prior year's worldwide branded average (up to a maximum of 5.0 stars) and 100 models, unless your instructor changes the model count.
Private-label demand grows faster than branded demand in every region, as the growth table shows, so it is an attractive route to higher total market share for a cost-efficient producer (Thompson et al., 2026).
Regional strategies and the price-volume-profit trade-off
You do not have to compete the same way everywhere. Thompson et al. (2026) list options that include leading in one or two regions, focusing on one segment, or tailoring a strategy region by region to counter specific rivals. The textbook's offensive and defensive strategies apply directly (Thompson, 2025):
Attack where rivals are weak. Offensives that exploit a rival's weak points, such as a low S/Q rating or a thin product line in a region, work better than head-on attacks on its strengths.
Cut price only from a cost advantage. A price-cutting offensive raises total profit only if the extra volume outweighs the thinner margin, and it works best for a company that already has lower costs.
Move into less contested ground. Building a position in regions or segments where rivals are thin can win share without a costly fight.
Defend by closing gaps. Adding models and keeping strong lineups in your best regions makes it harder for challengers to find openings.
Market share is a means, not an end. A meta-analysis of 863 elasticities from 89 studies found an average market share–financial performance elasticity of only 0.132, and the authors warned against strategies that chase share alone (Edeling & Himme, 2018). In BSG, the board scores EPS, ROE, stock price, credit rating, and image rating, not market share for its own sake. Your share target should come from your vision, mission, and strategic objectives, and every increase in effort should pass a profit check on the decision page.
Deciding where to push and where to hold is an offensive and defensive choice; see our guide to BSG offensive and defensive strategies for how to pick which rivals and regions to attack, and how to protect the share you already have.
Worked example: a price cut versus a balanced push
The figures below are hypothetical and simplified, with a single direct cost per pair, to show how the price-volume-profit trade-off works. Suppose a company sells 2.0 million branded wholesale pairs in Europe-Africa at $62 per pair, with direct costs of $46 per pair. The regional average wholesale price is $60, and the company's S/Q rating is slightly above average.
Hypothetical Europe-Africa wholesale scenarios (illustrative figures only)
| Scenario | Price | Pairs sold | Margin per pair | Contribution |
|---|---|---|---|---|
| Current plan | $62 | 2.0 million | $16 | $32.0 million |
| Price cut to $58 | $58 | 2.3 million | $12 | $27.6 million |
| Hold $62, add 25 models and $1.5 million brand advertising | $62 | 2.25 million | $15.70 (after extra set-up costs) | $33.8 million (after the extra advertising) |
Cutting the price to $58 raises volume by 15%, but it reduces the margin per pair from $16 to $12, a 25% drop. To break even, volume would need to rise by a third, to about 2.67 million pairs. The balanced push keeps the price, closes gaps on advertising and models, and earns about $1.8 million more than the current plan. In a real round, the decision page shows these numbers for you, and the right answer depends on what rivals do. That is why the competitive assumptions matter so much.
Decision routine (hypothetical)
Step 1: Update the competitive assumptions. If rivals are expected to cut the average wholesale price from $60 to $58, a $62 price now sits $4 above average rather than $2, and projected sales fall.
Step 2: Compare scenarios on the Wholesale Marketing page and keep the one with the best projected operating profit, not the most pairs.
Step 3: Check the online price stays at least 40% above wholesale ($62 × 1.4 = $86.80).
Step 4: Ship enough pairs to cover required inventory plus a modest surplus.
Step 5: After results arrive, compare actual efforts in the Competitive Intelligence Report with your assumptions and adjust.
Common mistakes when trying to increase demand in BSG
Leaving the competitive assumptions at last year's averages, so the projections overstate your sales.
Chasing volume with price cuts that shrink operating profit, especially without a cost advantage.
Setting the online price less than 40% above wholesale, which costs you retailers next year.
Bidding for celebrities beyond a combined appeal of 300 in a region, where they add nothing, or bidding round numbers that invite ties.
Expecting retail outlets to jump in one year; the network builds over several years.
Running out of inventory after a successful marketing push, which turns created demand into lost sales.
Overspending on minor factors such as 1-week delivery or $15 rebates without checking their cost per pair.
Ignoring the Competitive Intelligence Report, so you never learn which gaps cost you share.
For the bigger picture, see how to craft a strategy that beats your rivals in BSG.
Getting help with your BSG marketing decisions
If you would like a strategy specialist to talk through your competitive assumptions, regional pricing, or celebrity bids, see our Business Strategy Game coaching. We explain the reasoning so your team makes its own decisions, in line with your course's rules.
Frequently asked questions
How do you increase demand in the BSG game?
Beat the all-company regional average on the factors that matter most: price, S/Q rating, and number of models, then celebrities, brand advertising, search engine ads, image, retail outlets, and free shipping. Update the competitive assumptions so projections reflect rivals' likely moves, and hold enough inventory to fill the extra orders.
How do you increase market share in BSG?
Market share depends on the size of your advantage over the regional average on 13 competitive factors. Widen gaps where they are cheapest to widen, grow in the fast-growing Asia-Pacific and Latin America regions, and add private-label pairs, which count toward total market share and image rating.
How do celebrity endorsements work in BSG?
Celebrities sign with the highest annual offer (minimum $500,000, maximum $30 million) and start endorsing the following year. Their effect follows their regional appeal index, gains shrink once your combined appeal in a region reaches 200, and they stop above 300. Odd-number offers help avoid ties.
How much should you spend on brand advertising in BSG?
There is no fixed right amount. What matters is how your spending compares with this year's regional average. Spending above the average gives you an edge, but each extra dollar sells fewer pairs, so stop when the projected operating profit stops improving.
What should my online price be in BSG?
At least 40% above your wholesale price in that region (for example, $70 or more with a $50 wholesale price) and no more than $200. Below the 40% threshold, retailers see your website as a threat and some drop your brand the next year.
Are mail-in rebates worth it in BSG?
They are one of the least important factors, and their cost rises steeply: a $5 rebate costs about $1.25 per pair sold, while a $15 rebate costs $13.50. Use them only where the projected profit improves.
How do you get more retail outlets in BSG?
You cannot add them instantly. Retailer numbers grow over several years with higher market share, a higher S/Q rating, shorter delivery times, above-average retailer support, and a strong image rating, and they shrink if your online price undercuts the 40% rule.
What are competitive assumptions in BSG?
They are your estimates of this year's all-company regional averages: 7 entries on the Wholesale Marketing page and 3 on the Internet Marketing page in each region. They start at last year's averages, and updating them makes your sales and profit projections far more accurate.
References
- Bijmolt, T. H. A., van Heerde, H. J., & Pieters, R. G. M. (2005). New empirical generalizations on the determinants of price elasticity. Journal of Marketing Research, 42(2), 141–156. https://doi.org/10.1509/jmkr.42.2.141.62296
- Edeling, A., & Himme, A. (2018). When does market share matter? New empirical generalizations from a meta-analysis of the market share–performance relationship. Journal of Marketing, 82(3), 1–24. https://doi.org/10.1509/jm.16.0250
- Knoll, J., & Matthes, J. (2017). The effectiveness of celebrity endorsements: A meta-analysis. Journal of the Academy of Marketing Science, 45(1), 55–75. https://doi.org/10.1007/s11747-016-0503-8
- Sethuraman, R., Tellis, G. J., & Briesch, R. A. (2011). How well does advertising work? Generalizations from meta-analysis of brand advertising elasticities. Journal of Marketing Research, 48(3), 457–471. https://doi.org/10.1509/jmkr.48.3.457
- Thompson, A. A. (2025). Strategy: Core concepts and analytical approaches (8th ed.). McGraw Hill.
- Thompson, A. A., Stappenbeck, G. J., & Reidenbach, M. A. (2026). The Business Strategy Game player's guide (2026 ed.). GLO-BUS Software. https://www.bsg-online.com